
用均匀花瓣绘制蟒蛇的玫瑰曲线
用均匀花瓣绘制蟒蛇的玫瑰曲线
提问于 2021-06-15 15:45:18
我试图用下面的代码在python中绘制一个玫瑰曲线:
import numpy as np
from matplotlib import pyplot as plt
theta = np.linspace(0, 2*np.pi, 1000)
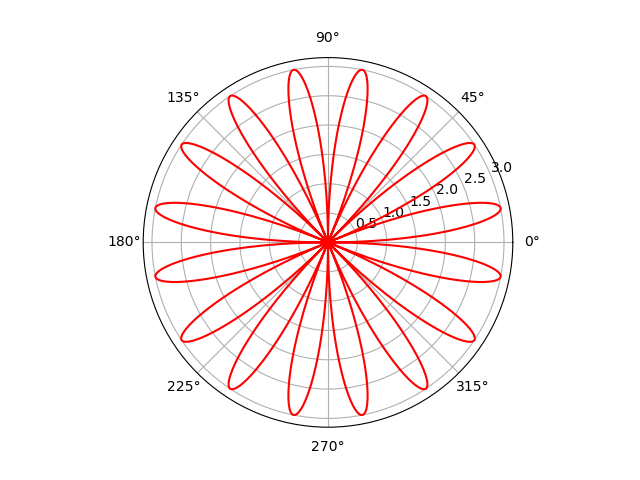
r = 3* np.sin(8 * theta)
plt.polar(theta, r, 'r')
plt.show()这是玫瑰曲线$r = 3 \sin{8\theta}$,因为$8$也是这样,所以曲线应该有$2.8 = 16$花瓣。但产量给了我一朵8美元花瓣的玫瑰。
我不确定python是否理解rose曲线的数学定义,或者我们修改了定义,以便Python能够理解它。我怎样才能得到我想要的输出?
回答 1
Stack Overflow用户
回答已采纳
发布于 2021-06-15 16:13:28
您的问题类似于在以下相关问题中遇到的问题:Polar plot of a function with negative radii using matplotlib
问题是,matplotlib.pyplot.polar做的是,而不是,用极坐标绘制一条曲线,就像数学家所期望的那样。
数学家会期望半径为0表示原点,而负半径则反映在原点上;特别是极坐标(r, t)和(-r, t+pi)应该指定相同的点。
当pi为负值时,可以手动将r添加到theta,并用其绝对值替换r,从而强制执行此行为。
import numpy as np
from matplotlib import pyplot as plt

theta = np.linspace(0, 2*np.pi, 1000)

r = 3* np.sin(8 * theta)

# plt.polar(theta, r, 'r')  # remove this line
plt.polar(theta+(r<0)*np.pi, np.abs(r), 'r')

plt.show()
页面原文内容由Stack Overflow提供。腾讯云小微IT领域专用引擎提供翻译支持
原文链接:
https://stackoverflow.com/questions/67989467
复制相关文章
相似问题
腾讯云开发者

Copyright © 2013 - 2026 Tencent Cloud. All Rights Reserved. 腾讯云 版权所有
深圳市腾讯计算机系统有限公司 ICP备案/许可证号:粤B2-20090059 ![]() 粤公网安备44030502008569号
粤公网安备44030502008569号
腾讯云计算(北京)有限责任公司 京ICP证150476号 | 京ICP备11018762号