
实际上-使用nidaqmx的Dash,名称'task‘不是定义错误。
实际上-使用nidaqmx的Dash,名称'task‘不是定义错误。
提问于 2021-06-16 23:09:24
我正在通过windows使用python,并试图使用加速度计读取NI 9234中的数据。我希望远程读取这些数据,并为此使用Dash。对于NI部分,我尝试使用nidaqmx,使用这个示例。
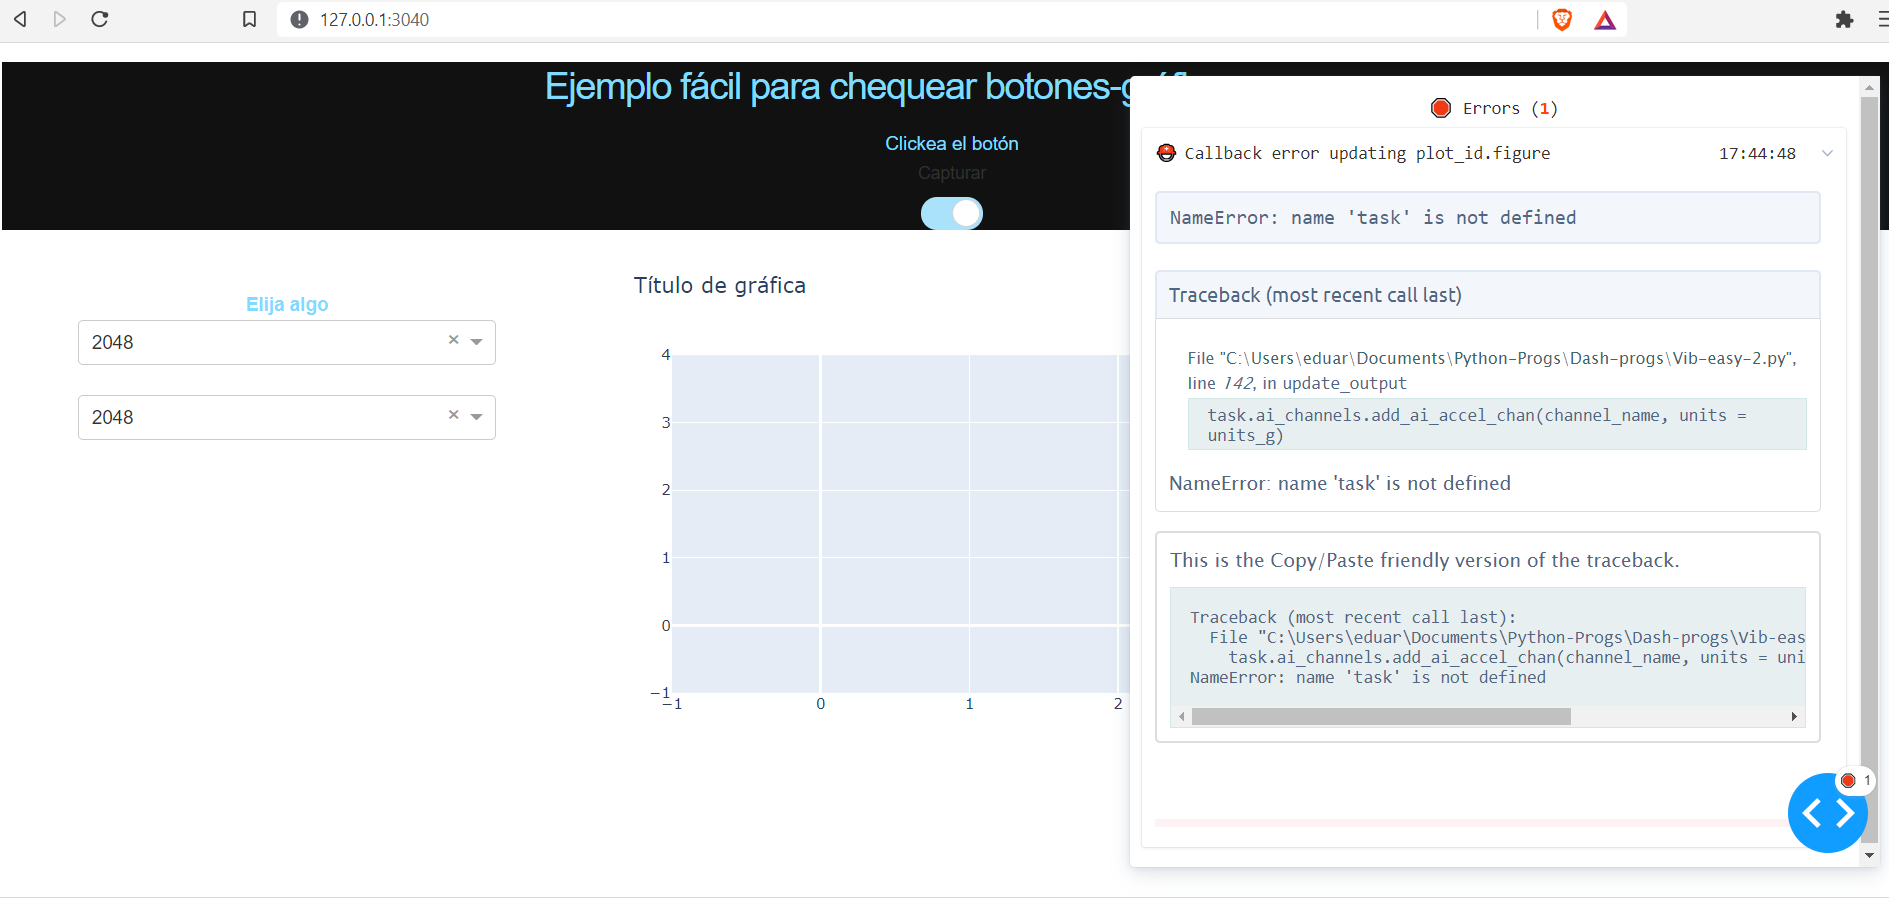
我的dash程序现在很容易,它没有nidaqmx部分的工作(做一些非常容易的事情),而nidaqmx程序成功地从传感器读取数据。如果我试图将它们合并在一起,则会得到以下错误:
这是我的剧本:
import dash
import dash_daq as daq
import dash_core_components as dcc
import dash_html_components as html
from dash.dependencies import Input, Output
import plotly.graph_objects as go
from dash.exceptions import PreventUpdate
import nidaqmx
from nidaqmx.constants import AcquisitionType
import numpy as np

external_stylesheets = ['https://codepen.io/chriddyp/pen/bWLwgP.css']

app = dash.Dash(__name__, external_stylesheets=external_stylesheets)

# some color to this
colors = {
    'background': '#111111',
    'text': '#7FDBFF'
}

#Initial conditions to have something in the graph
trace_1 = go.Scatter(
    x = [],
    y = []
)

layout = go.Layout(title = 'Título de gráfica')
fig = go.Figure(data = [trace_1], layout = layout)

app.layout = html.Div(style = {'backgroundColor': colors['background']},
    children = [

# H3 es para marcar el título, es el mediano que los demás, H1 es súper grande.
    html.H3(
        children = 'Ejemplo fácil para chequear botones-gráficas-menus',
            style = {
            'textAlign': 'center',
            'color': colors['text']
        }
    ),

# Div parece que divide éste párrafo abajo de lo anterior
    html.Div(
        id= 'respuesta',
        children= 'Clickea el botón',
          style = {
            'textAlign': 'center',
            'color': colors['text']
        }
    ),
# Se define el botón:
    daq.BooleanSwitch(
        id = 'Swtc_1',
        label = 'Capturar',
        on = False
    ),

    html.Div(
        [
        html.Br(),
        html.Br(),
        html.Label(
            ['Elija algo'],
            style = {
                'font-weight': 'bold',
                'text-align': 'center',
                'color': colors['text']
            }
        ),
        dcc.Dropdown(
            id = 'f_muestreo',
                options = [
                    {'label' : '2048', 'value':'2048'},
                    {'label' : '2560', 'value':'2560'},
                    {'label' : '3200', 'value':'3200'},
                    {'label' : '5120', 'value':'5120'},
                    {'label' : '6400', 'value':'6400'},
                    {'label' : '10240', 'value':'10240'},
                    {'label' : '12800', 'value':'12800'},
                    {'label' : '25600', 'value':'25600'}
            ],
            value = '2048',
            multi = False,
            disabled = False,
            persistence = 'string',
            persistence_type = 'session'
        ),
        html.Br(),
        dcc.Dropdown(
            id = 'muestras',
                options = [
                    {'label' : '2048', 'value':'2048'},
                    {'label' : '4096', 'value':'4096'},
                    {'label' : '8192', 'value':'8192'},
                    {'label' : '16384', 'value':'16384'},
                    {'label' : '32768', 'value':'32768'},
                    {'label' : '65536', 'value':'65536'},
                    {'label' : '131072', 'value':'131072'}
            ],
            value = '2048',
            multi = False,
            disabled = False,
            persistence = 'string',
            persistence_type = 'session'
        )
        ],className = 'three columns'
    ),

# graph
    html.Div(
        [
        dcc.Graph(id = 'plot_id', figure = fig)
        ],className = 'eight columns'
    )
    ]
)

# interaction
@app.callback(
    Output('plot_id', 'figure'),
    [Input('Swtc_1', 'on'),
    Input('f_muestreo', 'value'),
    Input('muestras', 'value')]

)

def update_output(on, value_1, value_2):

    if on is True:
        sample_rate = float(value_1)
        samples_to_acq = float(value_2)
        wait_time = samples_to_acq/sample_rate
        #Name and channel of my NI 9234
        channel_name = 'cDAQBAYO1Mod1/ai0'
        #Not using the trig yet
        #trig_name = 'cDAQBAYO1Mod1/ai1'
        cont_mode = AcquisitionType.CONTINUOUS
        units_g = nidaqmx.constants.AccelUnits.G

        # Create accelerometer channel and configure sample clock and trigger specs
        task.ai_channels.add_ai_accel_chan(channel_name, units = units_g)
        task.timing.cfg_samp_clk_timing(sample_rate, sample_mode = cont_mode, samps_per_chan=samples_to_acq)
        #task.triggers.start_trigger.cfg_dig_edge_start_trig(trigger_source = trig_name)

        # Reading data from sensor and generating time data with numpy
        ydata = task.read(number_of_samples_per_channel=samples_to_acq)
        xdata = np.linspace(0, wait_time,samples_to_acq)

        trace_1 = go.Scatter(
            x = list(xdata),
            y = list(ydata)
        )
        layout = go.Layout(title = 'Oscilograma')
        fig = go.Figure(data = [trace_1], layout = layout)
        return (fig)
    else:
        raise PreventUpdate


if __name__ == '__main__':
    app.run_server(port=3040, debug=True)
我在想,也许dash不支持nidaqmx,如果是这样的话,一个可能的解决方案是使用两个脚本:一个用于读取传感器,另一个用于向用户显示信息.然而,为了澄清的目的,我试图把所有的东西都放在一个脚本中。
到处搜索,但找不到nidaqmx正在实现为破折号。任何帮助都是非常感谢的。
回答 1
Stack Overflow用户
回答已采纳
发布于 2021-06-16 23:51:27
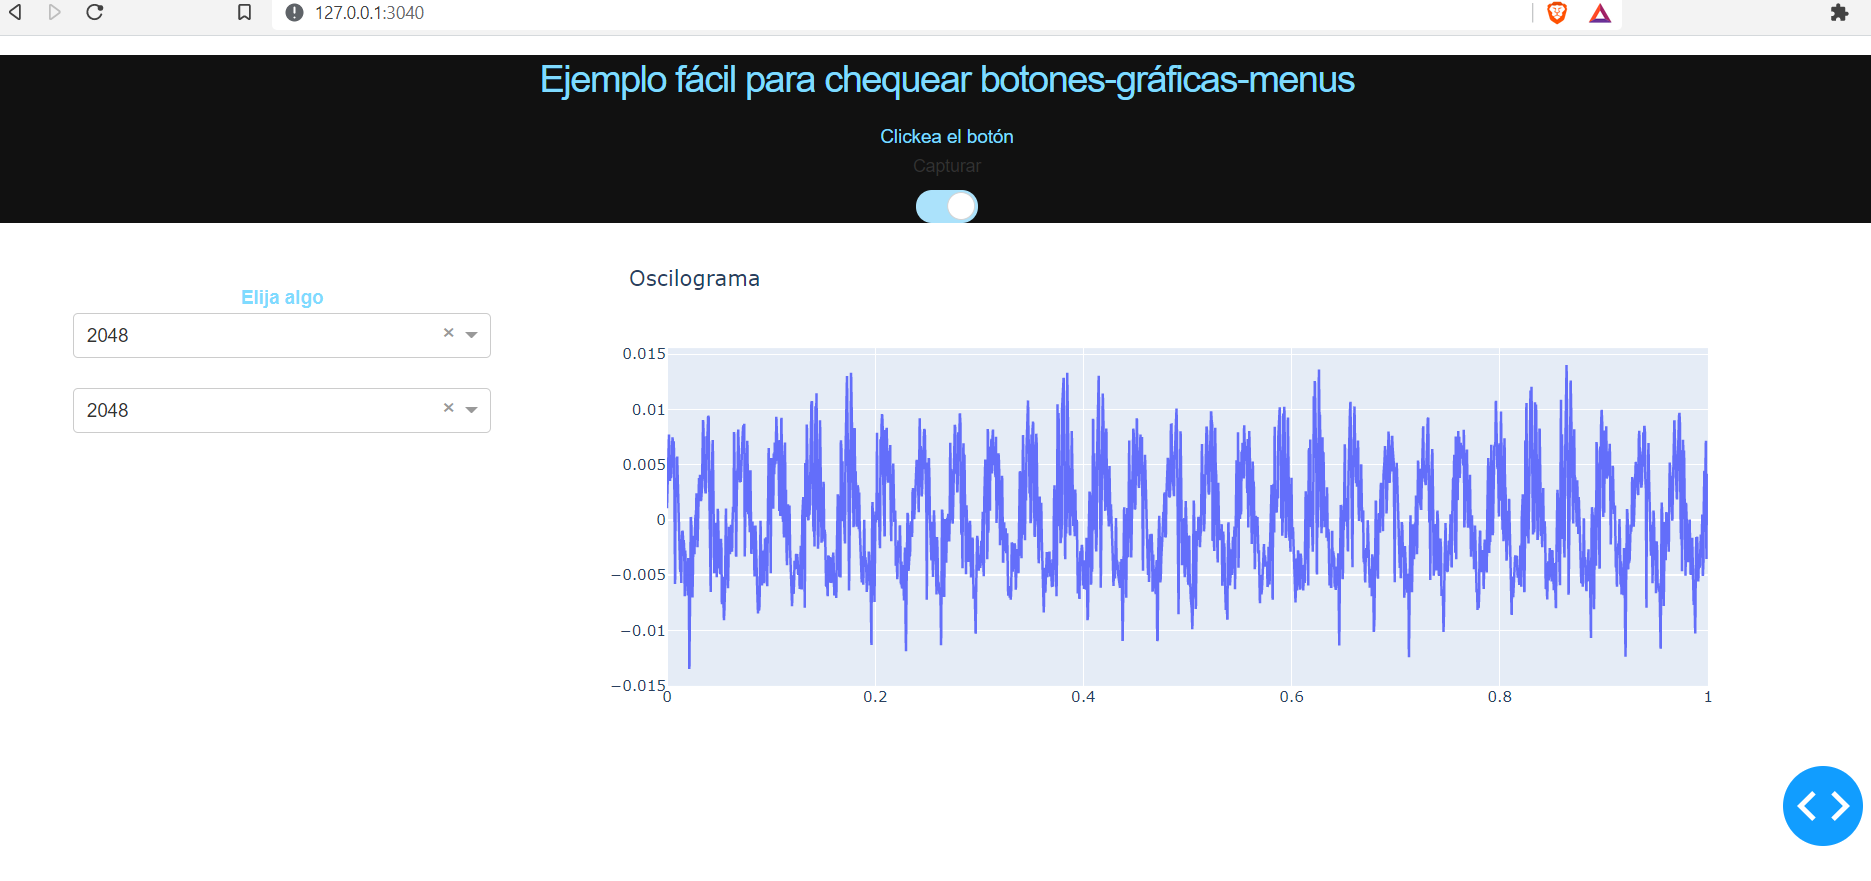
谢谢,dm2!就像你说的,我没有声明任务,我也遇到了一个类型问题,我需要进一步研究,但现在我将声明我的值为int。我之所以发布这个解决方案,是因为我想世界上到处都是像我一样的新人:
import dash
import dash_daq as daq
import dash_core_components as dcc
import dash_html_components as html
from dash.dependencies import Input, Output
import plotly.graph_objects as go
from dash.exceptions import PreventUpdate
import nidaqmx
from nidaqmx.constants import AcquisitionType
import numpy as np


external_stylesheets = ['https://codepen.io/chriddyp/pen/bWLwgP.css']

app = dash.Dash(__name__, external_stylesheets=external_stylesheets)

# some color to this
colors = {
    'background': '#111111',
    'text': '#7FDBFF'
}

#Initial conditions to have something in the graph
trace_1 = go.Scatter(
    x = [],
    y = []
)

layout = go.Layout(title = 'Título de gráfica')
fig = go.Figure(data = [trace_1], layout = layout)

app.layout = html.Div(style = {'backgroundColor': colors['background']},
    children = [

# H3 es para marcar el título, es el mediano que los demás, H1 es súper grande.
    html.H3(
        children = 'Ejemplo fácil para chequear botones-gráficas-menus',
            style = {
            'textAlign': 'center',
            'color': colors['text']
        }
    ),

# Div parece que divide éste párrafo abajo de lo anterior
    html.Div(
        id= 'respuesta',
        children= 'Clickea el botón',
          style = {
            'textAlign': 'center',
            'color': colors['text']
        }
    ),
# Se define el botón:
    daq.BooleanSwitch(
        id = 'Swtc_1',
        label = 'Capturar',
        on = False
    ),

    html.Div(
        [
        html.Br(),
        html.Br(),
        html.Label(
            ['Elija algo'],
            style = {
                'font-weight': 'bold',
                'text-align': 'center',
                'color': colors['text']
            }
        ),
        dcc.Dropdown(
            id = 'f_muestreo',
                options = [
                    {'label' : '2048', 'value':'2048'},
                    {'label' : '2560', 'value':'2560'},
                    {'label' : '3200', 'value':'3200'},
                    {'label' : '5120', 'value':'5120'},
                    {'label' : '6400', 'value':'6400'},
                    {'label' : '10240', 'value':'10240'},
                    {'label' : '12800', 'value':'12800'},
                    {'label' : '25600', 'value':'25600'}
            ],
            value = '2048',
            multi = False,
            disabled = False,
            persistence = 'string',
            persistence_type = 'session'
        ),
        html.Br(),
        dcc.Dropdown(
            id = 'muestras',
                options = [
                    {'label' : '2048', 'value':'2048'},
                    {'label' : '4096', 'value':'4096'},
                    {'label' : '8192', 'value':'8192'},
                    {'label' : '16384', 'value':'16384'},
                    {'label' : '32768', 'value':'32768'},
                    {'label' : '65536', 'value':'65536'},
                    {'label' : '131072', 'value':'131072'}
            ],
            value = '2048',
            multi = False,
            disabled = False,
            persistence = 'string',
            persistence_type = 'session'
        )
        ],className = 'three columns'
    ),

# graph
    html.Div(
        [
        dcc.Graph(id = 'plot_id', figure = fig)
        ],className = 'eight columns'
    )
    ]
)

# interaction
@app.callback(
    Output('plot_id', 'figure'),
    [Input('Swtc_1', 'on'),
    Input('f_muestreo', 'value'),
    Input('muestras', 'value')]

)

def update_output(on, value_1, value_2):

    if on is True:
        sample_rate = int(value_1)
        samples_to_acq = int(value_2)
        wait_time = samples_to_acq/sample_rate
        #Name and channel of my NI 9234
        channel_name = 'cDAQBAYO1Mod1/ai0'
        #Not using the trig yet
        #trig_name = 'cDAQBAYO1Mod1/ai1'
        cont_mode = AcquisitionType.CONTINUOUS
        units_g = nidaqmx.constants.AccelUnits.G
        with nidaqmx.Task() as task:
        # Create accelerometer channel and configure sample clock and trigger specs
            task.ai_channels.add_ai_accel_chan(channel_name, units = units_g)
            task.timing.cfg_samp_clk_timing(sample_rate, sample_mode = cont_mode, samps_per_chan=samples_to_acq)
            #task.triggers.start_trigger.cfg_dig_edge_start_trig(trigger_source = trig_name)

            # Reading data from sensor and generating time data with numpy
            ydata = task.read(number_of_samples_per_channel=samples_to_acq)
            xdata = np.linspace(0, wait_time,samples_to_acq)

            trace_1 = go.Scatter(
                x = list(xdata),
                y = list(ydata)
            )
            layout = go.Layout(title = 'Oscilograma')
            fig = go.Figure(data = [trace_1], layout = layout)
        return (fig)
    else:
        raise PreventUpdate


if __name__ == '__main__':
    app.run_server(port=3040, debug=True)
传感器正在读取数据!!
页面原文内容由Stack Overflow提供。腾讯云小微IT领域专用引擎提供翻译支持
原文链接:
https://stackoverflow.com/questions/68011017
复制相关文章
相似问题
腾讯云开发者

Copyright © 2013 - 2026 Tencent Cloud. All Rights Reserved. 腾讯云 版权所有
深圳市腾讯计算机系统有限公司 ICP备案/许可证号:粤B2-20090059 ![]() 粤公网安备44030502008569号
粤公网安备44030502008569号
腾讯云计算(北京)有限责任公司 京ICP证150476号 | 京ICP备11018762号