
将图例标签添加到ggplot的条形图中。
将图例标签添加到ggplot的条形图中。
提问于 2021-06-27 18:01:21
我想将集群名称添加到ggplot中的堆叠桶图中。
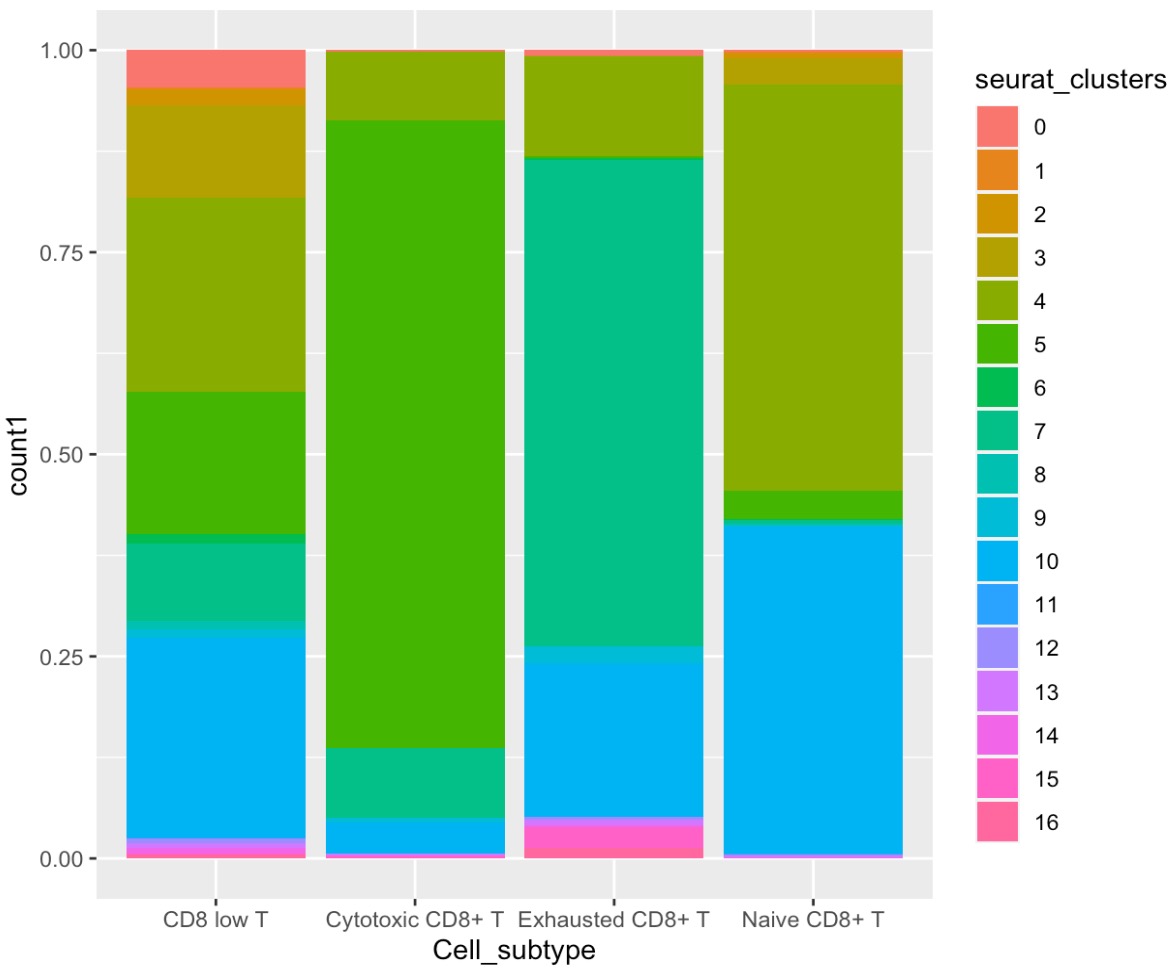
正如你所看到的,有些星系团的分数很小,而且每个条形中有很多星系团。这使得我们很难看到哪些星系团是哪个,特别是在相似的颜色之间。理想情况下,我希望有选择地给一些大分数(或集群)贴上它的名称,比如当百分比大于5%时,显示它的集群名称。
例如,在示例‘朴素CD8 T’中,我希望将集群4和5标记为:
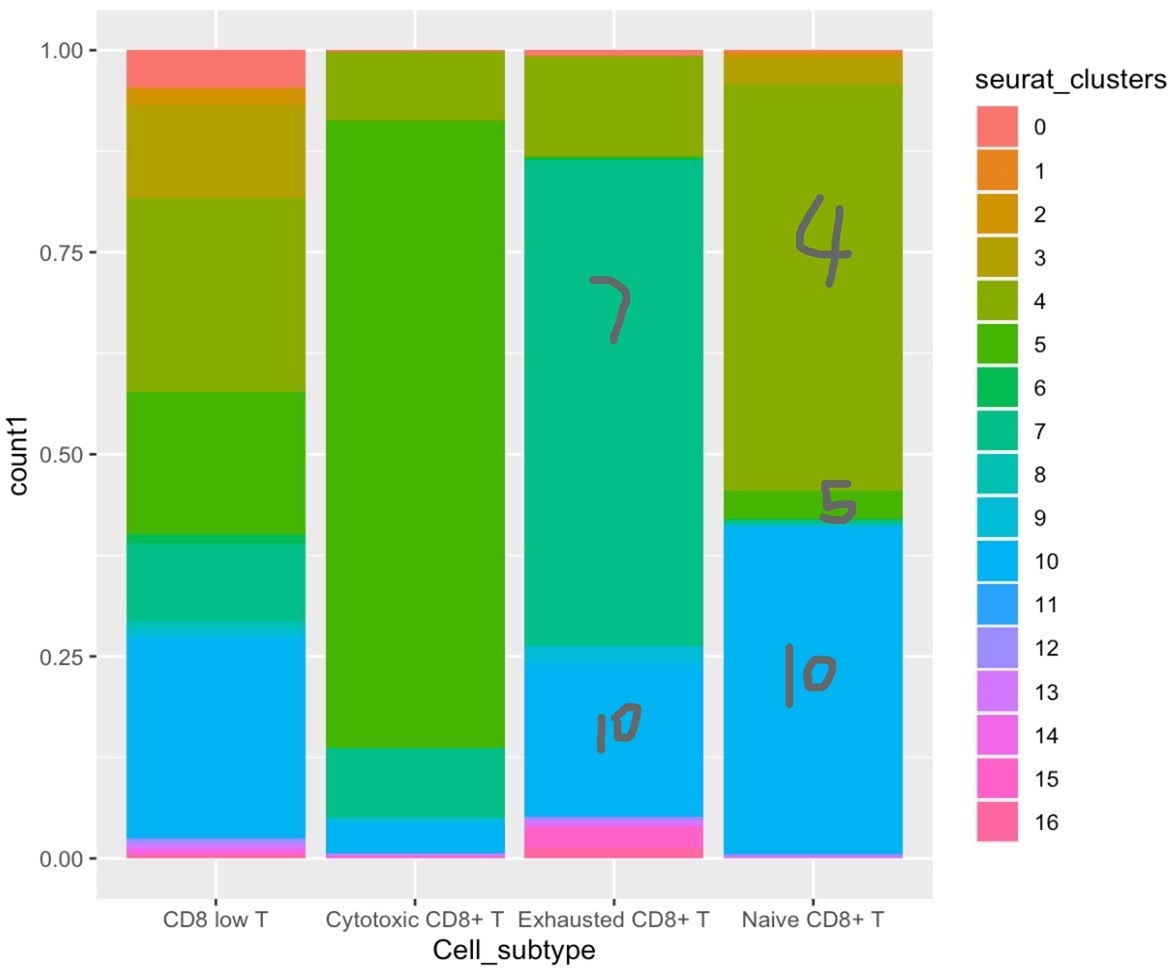
cluster.count %>%
  ggplot(aes(x=Cell_subtype,y=count1, fill= seurat_clusters)) +
geom_bar(stat="identity", position = 'fill')回答 1
Stack Overflow用户
回答已采纳
发布于 2021-06-27 19:10:32
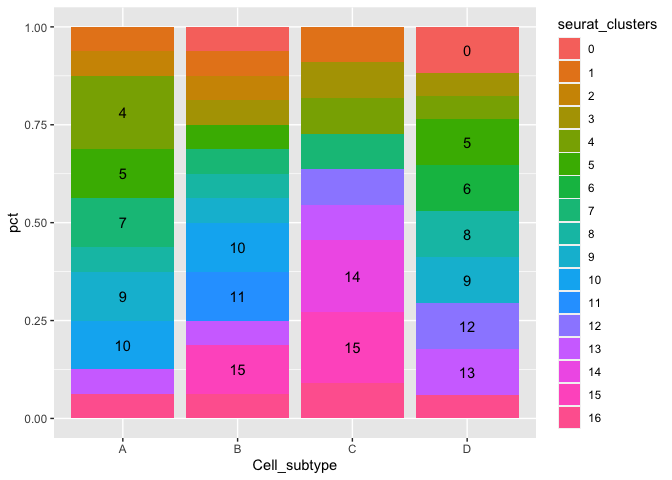
这一目标可以这样实现:
- ,而不是使用
position="fill",我可以通过position="fill"标签手动计算百分比,然后可以通过geom_text轻松地添加,在geom_text中,您可以使用ifelse只显示所需的最小频率或比例的标签。
利用一些随机的示例数据,尝试如下:
library(ggplot2)
library(dplyr)

set.seed(42)
cluster.count <- data.frame(
  Cell_subtype = sample(LETTERS[1:4], 60, replace = TRUE),
  seurat_clusters = sample(0:16, 60, replace = TRUE)
)
cluster.count <- count(cluster.count, Cell_subtype, seurat_clusters, name = "count1")
cluster.count <- mutate(cluster.count, seurat_clusters = factor(seurat_clusters))

cluster.count %>%
  group_by(Cell_subtype) %>%
  mutate(pct = count1 / sum(count1)) %>%
  ggplot(aes(x=Cell_subtype,y=pct, fill= seurat_clusters)) +
  geom_col() +
  geom_text(aes(label = ifelse(pct > .1, as.character(seurat_clusters), "")), position = position_stack(vjust = .5))
页面原文内容由Stack Overflow提供。腾讯云小微IT领域专用引擎提供翻译支持
原文链接:
https://stackoverflow.com/questions/68153954
复制相关文章
相似问题
腾讯云开发者

Copyright © 2013 - 2026 Tencent Cloud. All Rights Reserved. 腾讯云 版权所有
深圳市腾讯计算机系统有限公司 ICP备案/许可证号:粤B2-20090059 ![]() 粤公网安备44030502008569号
粤公网安备44030502008569号
腾讯云计算(北京)有限责任公司 京ICP证150476号 | 京ICP备11018762号