
异步分析器查看jvm支持的分析事件列表
异步分析器查看jvm支持的分析事件列表
提问于 2021-06-28 10:57:30
我试图查看jvm支持的分析事件列表。正如在文档中提到的,我使用了list命令,如下所示-
root@vrni-platform:/home/ubuntu/async-profiler-2.0-linux-x64# ./profiler.sh list 10208
Basic events:
  cpu
  alloc
  lock
  wall
  itimer
Java method calls:
  ClassName.methodName
Perf events:
  page-faults
  context-switches
  cycles
  instructions
  cache-references
  cache-misses
  branches
  branch-misses
  bus-cycles
  L1-dcache-load-misses
  LLC-load-misses
  dTLB-load-misses
  mem:breakpoint
trace:tracepoint在上面的输出中,我没有看到这个回答中提到的事件。但是,如果我执行上面的事件,正如在这个答案中提到的,它似乎是有效的。
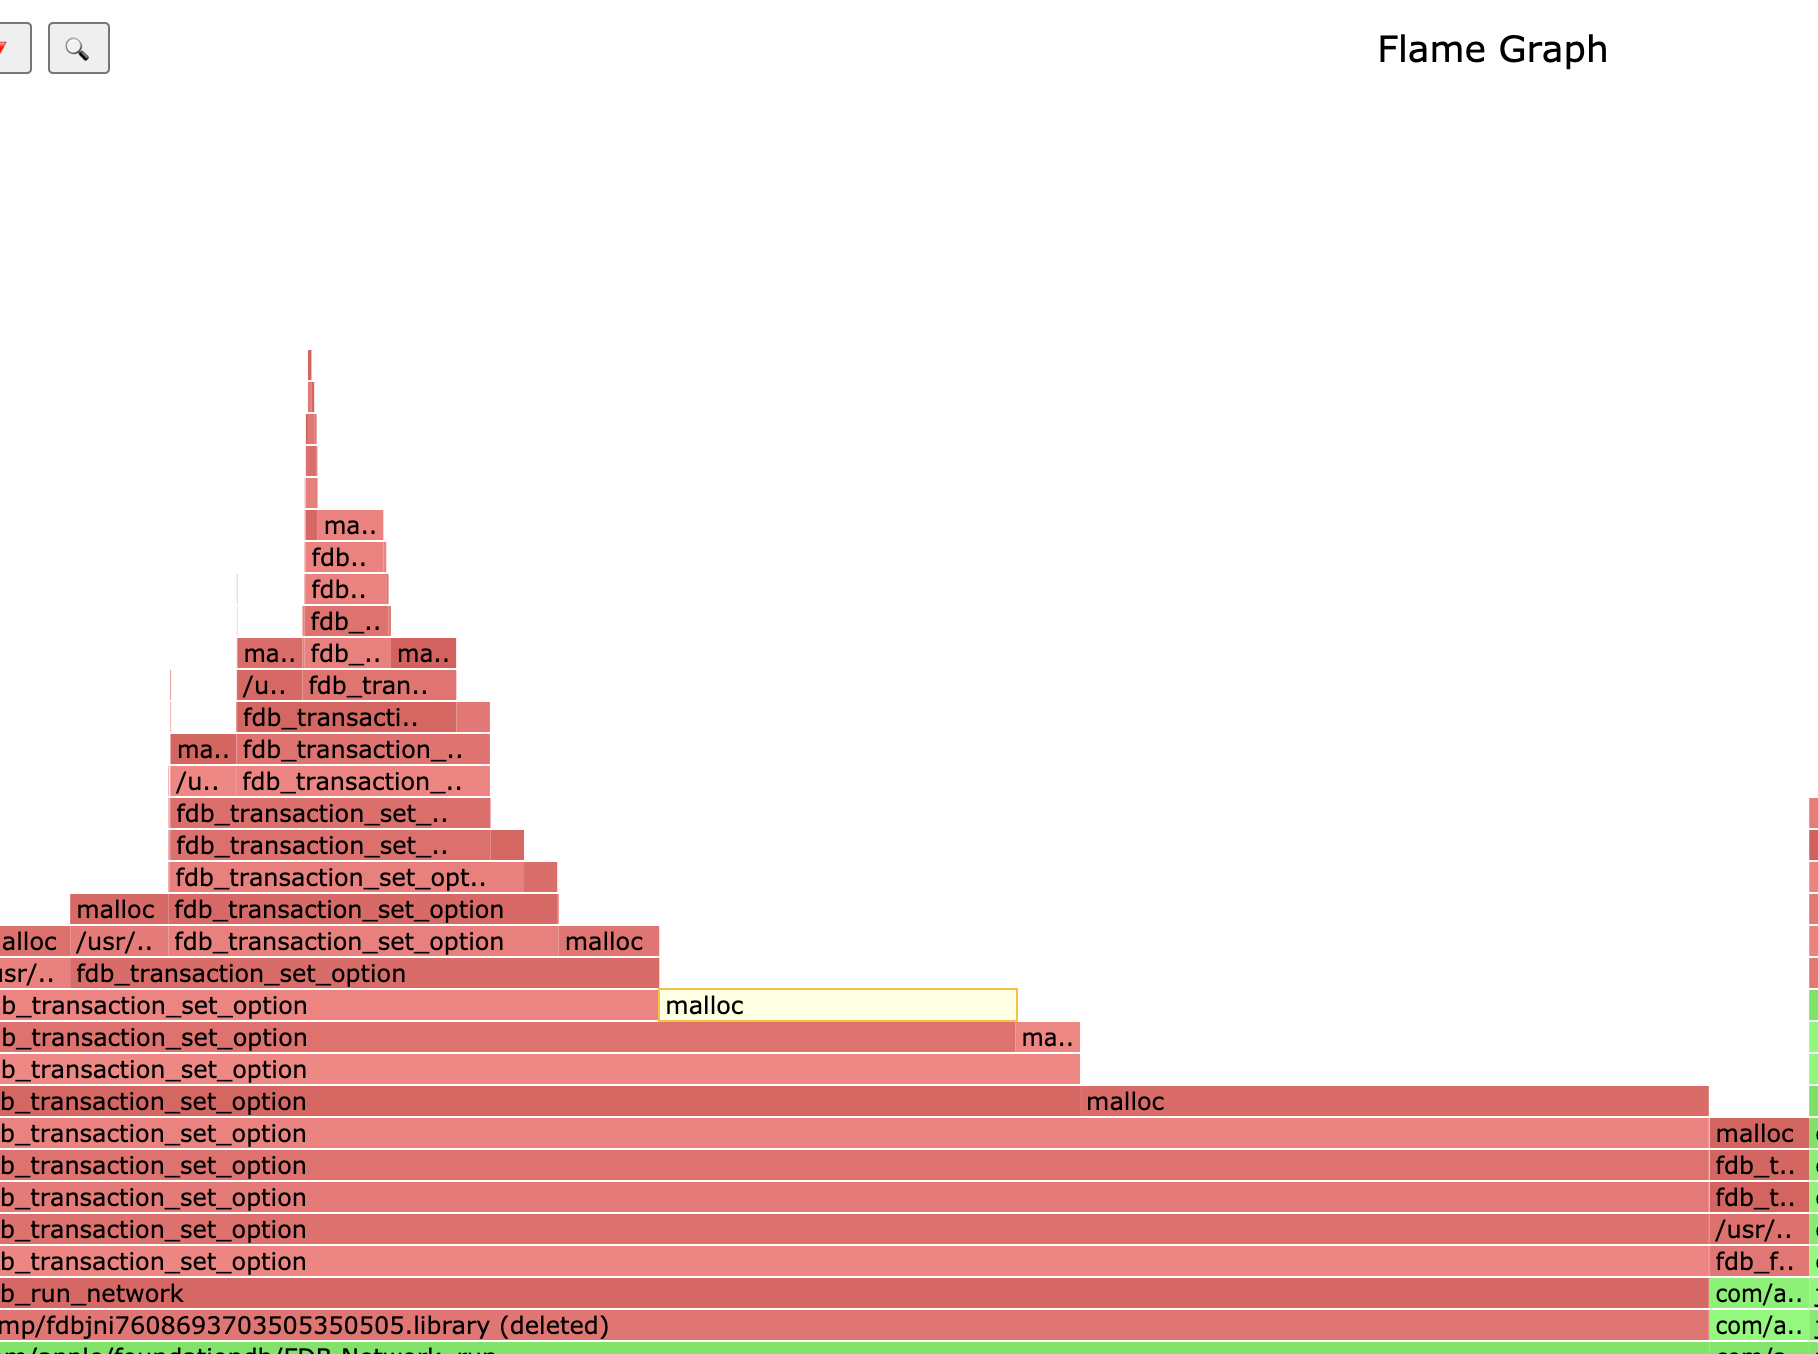
root@vrni-platform:/home/ubuntu/async-profiler-2.0-linux-x64# ./profiler.sh -e malloc -d 30 -f /tmp/flamegraph.html 10208
Profiling for 30 seconds
Done
有人能让我知道如何查看特定jvm的aysnc-分析器所支持的所有事件列表吗?如果list是profiler.sh的正确参数,那么为什么malloc等显示在所有事件的列表中?
环境
ubuntu@vrni-platform:~/async-profiler-2.0-linux-x64# ./profiler.sh --version
Async-profiler 2.0 built on Mar 14 2021
Copyright 2016-2021 Andrei Panginubuntu@vrni-platform:~/async-profiler-2.0-linux-x64# uname -a
Linux vrni-platform 4.15.0-142-generic #146-Ubuntu SMP Tue Apr 13 01:11:19 UTC 2021 x86_64 x86_64 x86_64 GNU/Linuxubuntu@vrni-platform:~/async-profiler-2.0-linux-x64$ java -version
openjdk version "11.0.11" 2021-04-20 LTS
OpenJDK Runtime Environment Zulu11.48+22-SA (build 11.0.11+9-LTS)
OpenJDK 64-Bit Server VM Zulu11.48+22-SA (build 11.0.11+9-LTS, mixed mode)回答 1
Stack Overflow用户
回答已采纳
发布于 2021-06-28 13:01:11
这里的malloc不是一个单独的事件。这只是一个执行断点的例子。
异步分析器在硬件断点的帮助下,可以跟踪对任何内存位置的访问.使用硬件断点的类perf语法,您可以选择分析代码中任何给定地址的执行情况:
./profiler.sh -e mem:0x123450:x <pid>可以指定本机函数名,而不是数字地址。malloc只是标准C库(Libc)中函数的名称:
./profiler.sh -e mem:malloc:x <pid>-e malloc是上述事件描述符的快捷方式。如果异步分析器发现给定的事件名对应于某个本机函数,它将分析此函数的执行情况。
除了malloc之外,您还可以对任何其他函数进行分析。例如,
-e pthread_start来查找谁启动新线程(包括Java和本机线程);-e connect用于分析新的套接字连接;-e JVM_GC寻找System.gc()的呼叫者;-e G1CollectedHeap::humongous_obj_allocate用于分析G1的巨大分配;-e Deoptimization::uncommon_trap查找已编译代码的去优化位置;
等等,诸如此类。在JVM中,在标准类库中,在libc中有数千个本机函数。显然,在异步分析器帮助中列出它们是不可能的。
页面原文内容由Stack Overflow提供。腾讯云小微IT领域专用引擎提供翻译支持
原文链接:
https://stackoverflow.com/questions/68162130
复制相关文章
相似问题
腾讯云开发者

Copyright © 2013 - 2026 Tencent Cloud. All Rights Reserved. 腾讯云 版权所有
深圳市腾讯计算机系统有限公司 ICP备案/许可证号:粤B2-20090059 ![]() 粤公网安备44030502008569号
粤公网安备44030502008569号
腾讯云计算(北京)有限责任公司 京ICP证150476号 | 京ICP备11018762号