
实际上:当x轴显示日期时,如何注释最大值?
实际上:当x轴显示日期时,如何注释最大值?
提问于 2021-07-16 16:24:09
因此,我有一个数据帧(df_prod),其中包含一些光伏面板每小时发电量的时间序列。我有一个图表,并希望注释峰值。
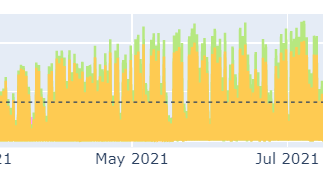
我知道如何找到值,但我不知道如何将峰值发生的日期作为注释的x值。我想我需要给它一根绳子,但我不确定。
这不管用:
for spal in df_prod.columns:
    maxvalue = df_prod[spal].max()
    fig.add_annotation(
    x = df_prod.index[df_prod[spal]==maxvalue],            # <--- this ist the problem
    y = wert,
    text='peak ' + spal + ': ' + str(f'{round(wert): n}') + ' kW',
    font={'size': 9} ,
    showarrow=True,
    arrowhead=3,
    xanchor='left',
    ax=20,
    ay=5,
    row=r,
    col=c
)回答 1
Stack Overflow用户
回答已采纳
发布于 2021-07-16 19:19:19
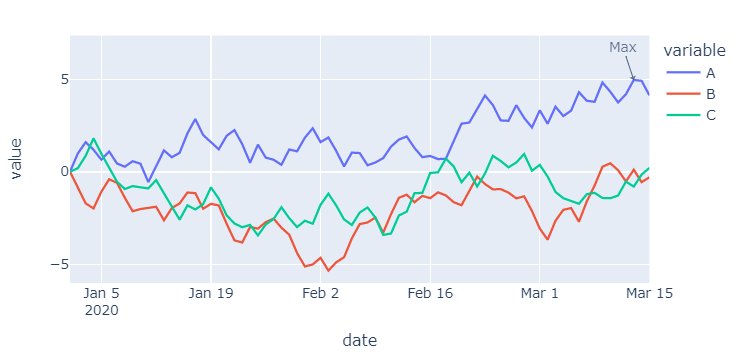
即使在索引是DatetimeIndex时,这也适用于多个时间序列。
fig.add_annotation(x=df.max(axis = 1).idxmax(),
                   y=df.max().max())
情节:
完整代码:
import plotly.express as px
import numpy as np
from datetime import datetime
import pandas as pd
np.random.seed(23)
observations = 75
df=pd.DataFrame(dict(A=np.random.uniform(low=-1, high=1.1, size=observations).tolist(),
                    B=np.random.uniform(low=-1, high=1.1, size=observations).tolist(),
                    C=np.random.uniform(low=-1, high=1.1, size=observations).tolist(),
                    ))
df.iloc[0,] = 0
df = df.cumsum()

firstdate = datetime(2020,1,1)
df['date'] = pd.date_range(firstdate, periods=df.shape[0]).tolist()
df.set_index('date', inplace=True)

# fig.add_annotation(x=df.max(axis = 1).idxmax(),
#                    y=df.max().max())

fig = px.line(df, x = df.index, y = df.columns)

fig.add_annotation(showarrow=True,
                   arrowhead=1,
                   align = 'right',
                   x=df.max(axis = 1).idxmax(),
                   y=df.max().max(),
                   text="Max",
                   opacity=0.7)
f = fig.full_figure_for_development(warn=False)
fig.show()页面原文内容由Stack Overflow提供。腾讯云小微IT领域专用引擎提供翻译支持
原文链接:
https://stackoverflow.com/questions/68412330
复制相关文章
相似问题
腾讯云开发者

Copyright © 2013 - 2026 Tencent Cloud. All Rights Reserved. 腾讯云 版权所有
深圳市腾讯计算机系统有限公司 ICP备案/许可证号:粤B2-20090059 ![]() 粤公网安备44030502008569号
粤公网安备44030502008569号
腾讯云计算(北京)有限责任公司 京ICP证150476号 | 京ICP备11018762号