
如何恢复两条简单线性回归线的斜率和标准误差?
如何恢复两条简单线性回归线的斜率和标准误差?
提问于 2021-08-02 07:43:09
我有一个data.frame:
 set.seed(12345)
 df <- data.frame(
      p=c(rep("A", 39), rep("B",61)),
      x=rnorm(100, 34, 20),
      y=rnorm(100, 21, 25))
如何获得以下四个变量:
斜率来自A组的简单线性回归线(比较x与y)。斜率来自B组的简单线性回归线(比较x与y)。A组简单线性回归线斜率的标准误差(比较x~ y)。B组简单线性回归线斜率的标准误差(比较x与y).
回答 2
Stack Overflow用户
回答已采纳
发布于 2021-08-02 08:19:50
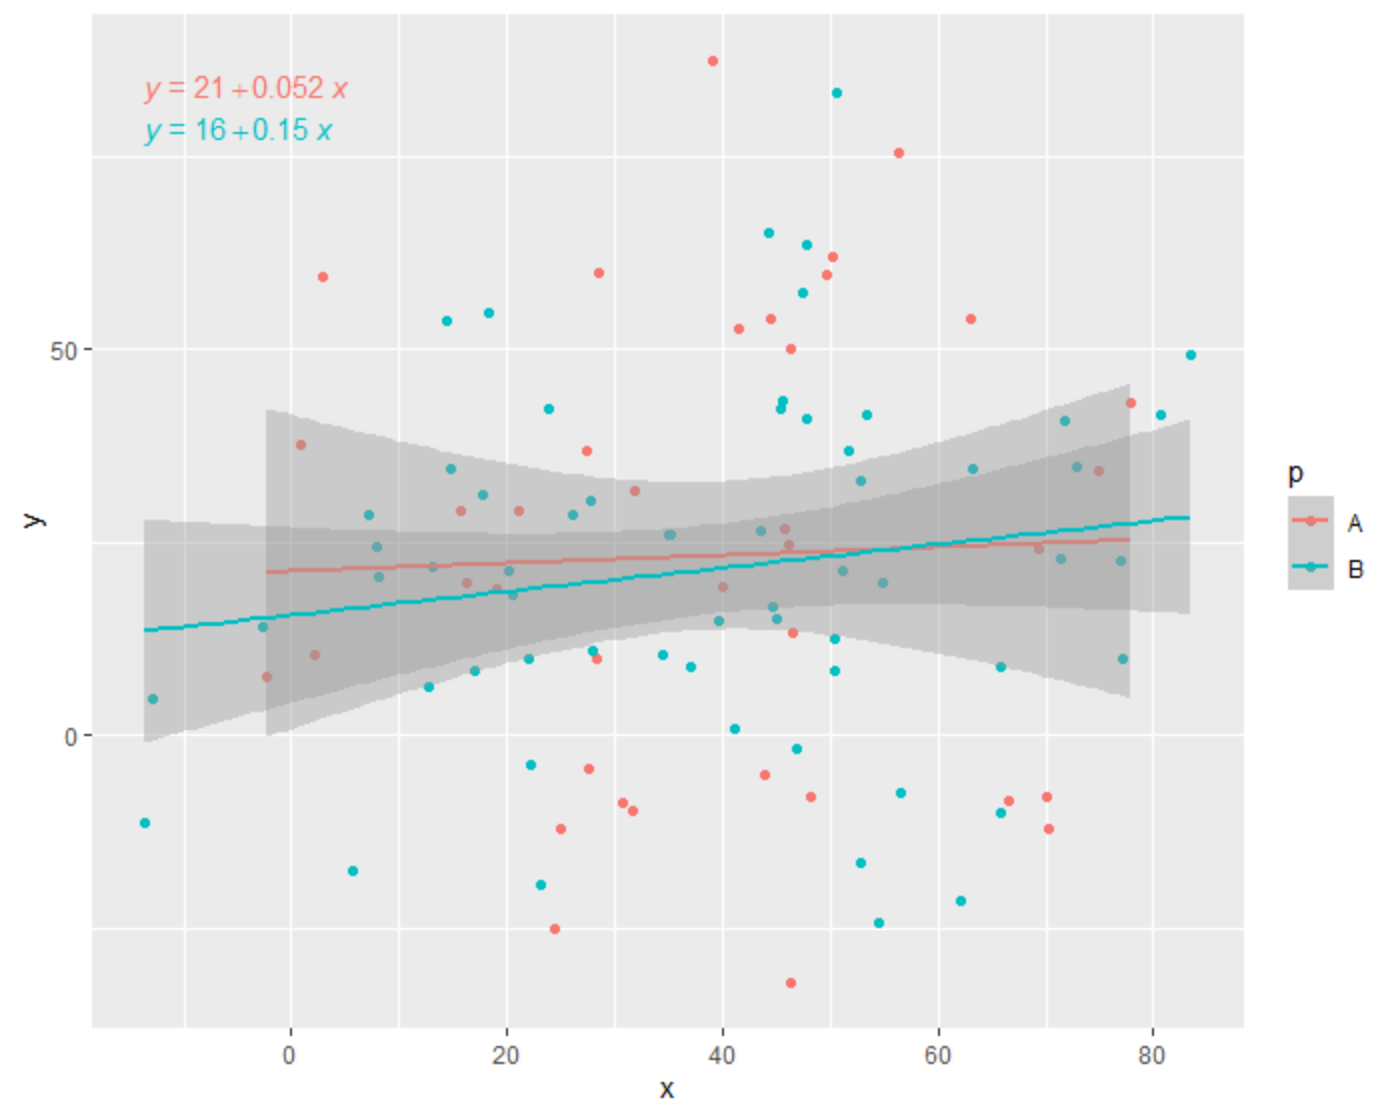
成千上万的可能性。您可以尝试这样做以实现可视化:
library(tidyverse)
library(ggpubr)
df %>%
  filter(p == "A") %>%
  ggplot(aes(x, y, color = p)) +
   geom_point() +
   geom_smooth(method = "lm") +
   ggpubr::stat_regline_equation(show.legend = F)
   geom_abline(slope = 0.0269, intercept = 38.3)
这是为了价值:
library(broom)
df %>%
  split(.$p) %>%
  map(~lm(y~x, data = .) %>% broom::tidy(.))
$A
# A tibble: 2 x 5
  term        estimate std.error statistic p.value
  <chr>          <dbl>     <dbl>     <dbl>   <dbl>
1 (Intercept)  21.2       10.1       2.11   0.0420
2 x             0.0517     0.228     0.227  0.822

$B
# A tibble: 2 x 5
  term        estimate std.error statistic p.value
  <chr>          <dbl>     <dbl>     <dbl>   <dbl>
1 (Intercept)   15.5       5.67       2.74 0.00821
2 x 0.153 0.125 1.22 0.229 Stack Overflow用户
发布于 2021-08-02 08:00:28
library(tidyverse)

set.seed(12345)
df <- data.frame(
  p=c(rep("A", 39), rep("B",61)),
  x=rnorm(100, 34, 20),
  y=rnorm(100, 21, 25))


#fit the regression
lm_A = lm(x~y, data=df %>% filter(p == "A"))
summary(lm_A)

lm_B = lm(x~y, data=df %>% filter(p == "B"))
summary(lm_B)
这四个问题的答案出现在回归摘要的“系数”选项卡中(其中“估计”是斜率,“Std”是斜率的标准误差)。
页面原文内容由Stack Overflow提供。腾讯云小微IT领域专用引擎提供翻译支持
原文链接:
https://stackoverflow.com/questions/68618039
复制相关文章
相似问题
腾讯云开发者

Copyright © 2013 - 2026 Tencent Cloud. All Rights Reserved. 腾讯云 版权所有
深圳市腾讯计算机系统有限公司 ICP备案/许可证号:粤B2-20090059 ![]() 粤公网安备44030502008569号
粤公网安备44030502008569号
腾讯云计算(北京)有限责任公司 京ICP证150476号 | 京ICP备11018762号