
线性回归模型成本函数的误判
我正在尝试渲染一个成本函数的3D图。给定一个数据集和两个不同的参数(theta0和theta1),我想呈现一个我们都在古典文学中看到的碗状图。我的假设函数只是一个简单的h(x) = theta_0 + theta_1 * x。不过,我的费用职能如下:
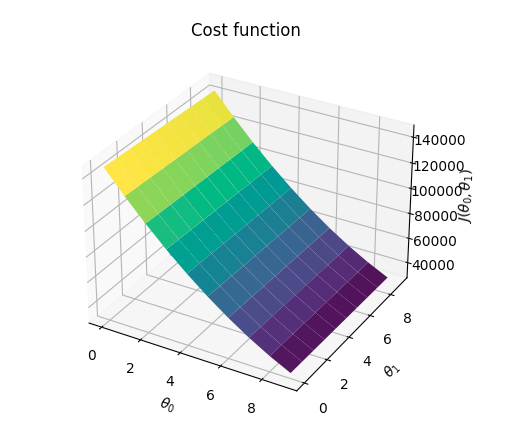
能搞到这个阴谋吗?如果是的话,我们又如何策划这样一个“碗”呢?
import matplotlib.pyplot as plt
import numpy as np

training_set = np.array([
    [20, 400],
    [30, 460],
    [10, 300],
    [50, 780],
    [15, 350],
    [60, 800],
    [19, 360],
    [31, 410],
    [5, 50],
    [46, 650],
    [37, 400],
    [39, 900]])

cost_factor = (1.0 / (len(training_set) * 2))

hypothesis = lambda theta0, theta1, x: theta0 + theta1 * x

cost = lambda theta0, theta1: cost_factor * sum(map(
    lambda entry: (hypothesis(theta0, theta1, entry[0]) - entry[1]) ** 2, training_set))

theta1 = np.arange(0, 10, 1)
theta2 = np.arange(0, 10, 1)

X, Y = np.meshgrid(theta1, theta1)

Z = cost(X, Y)

ax = plt.axes(projection='3d')
ax.plot_surface(X, Y, Z, cmap='viridis', edgecolor='none')
ax.set_xlabel(r'$\theta_0$')
ax.set_ylabel(r'$\theta_1$')
ax.set_zlabel(r'$J(\theta_0, \theta_1)$')
ax.set_title('Cost function')

plt.show()回答 1
Stack Overflow用户
发布于 2021-08-14 09:54:21
边注:
我在您的代码中将
- 改为
theta0,theta2改为theta1,以避免代码与情节 - 的标签混淆,代码中包含一个错误:
X, Y = np.meshgrid(theta1, theta1)应该是
您的Z曲面可能有一个绝对/相对最小/最大值点,它在您选择的域之外:0 < theta0 < 10和0 < theta1 < 10。您可以尝试扩展此间隔,以查看是否确实存在一个静止点:
theta0 = np.arange(-100, 100, 5)
theta1 = np.arange(-100, 100, 5)
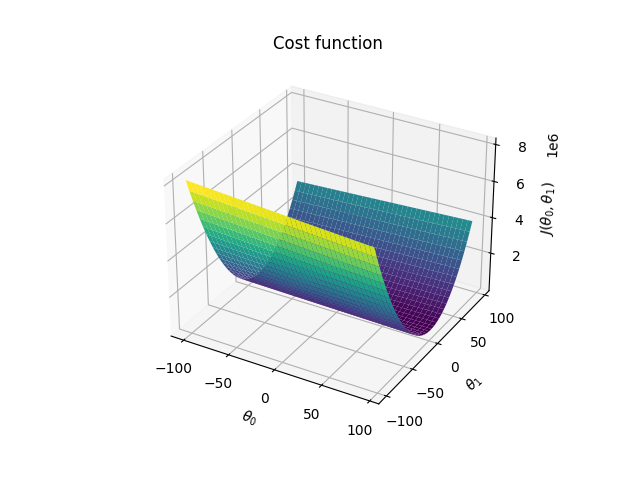
因此,-50 < theta1 < 50有一个最小区域。在theta0方向上,您的2D表面似乎没有最小值;但是,您也可以尝试扩展此域:
theta0 = np.arange(-1000, 1000, 100)
theta1 = np.arange(-50, 50, 1)
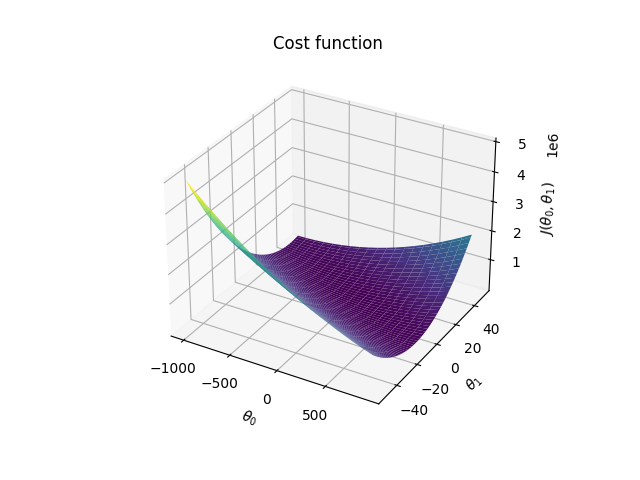
因此,您可以看到,您的Z曲面没有最小点,而是一个与theta0或theta1都不对齐的最小区域。
因为我不知道theta0和theta1实际上代表什么,所以我可能给它们分配了一些没有意义的值:例如,如果它们分别是纬度和经度,那么它们的域应该是-90 < theta0 < 90和0 < theta1 < 180。这取决于theta0和theta1的物理意义。
但是,您可以使用np.gradient计算曲面的梯度并绘制它们:
g1, g2 = np.gradient(Z)

fig = plt.figure()
ax1 = fig.add_subplot(1, 3, 1, projection = '3d')
ax2 = fig.add_subplot(1, 3, 2, projection = '3d')
ax3 = fig.add_subplot(1, 3, 3, projection = '3d')
ax1.plot_surface(X, Y, Z, cmap='viridis', edgecolor='none')
ax2.plot_surface(X, Y, g1, cmap='viridis', edgecolor='none')
ax3.plot_surface(X, Y, g2, cmap='viridis', edgecolor='none')

ax1.set_xlabel(r'$\theta_0$')
ax1.set_ylabel(r'$\theta_1$')
ax1.set_zlabel(r'$J(\theta_0, \theta_1)$')
ax1.set_title('Cost function')

ax2.set_xlabel(r'$\theta_0$')
ax2.set_ylabel(r'$\theta_1$')

ax3.set_xlabel(r'$\theta_0$')
ax3.set_ylabel(r'$\theta_1$')

plt.show()
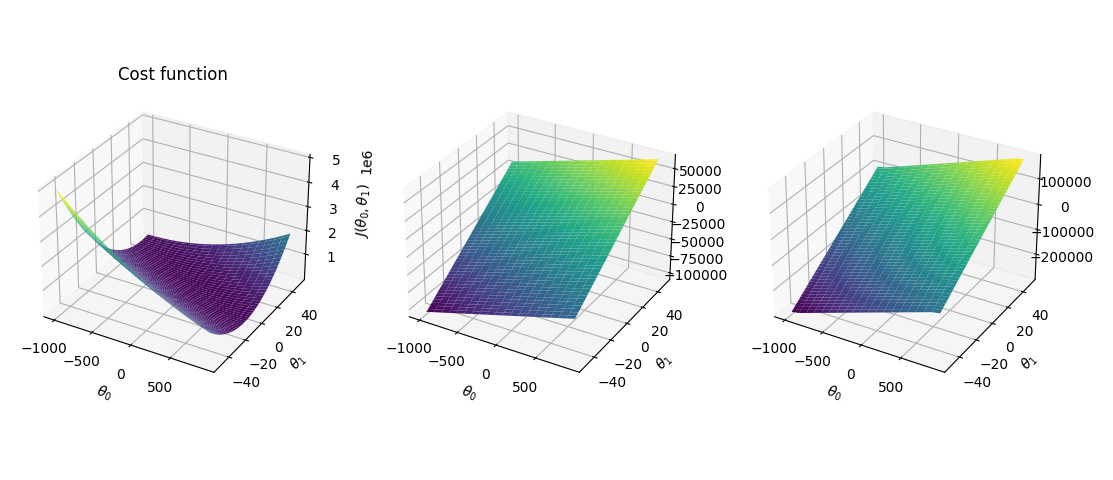
您可以看到,梯度为null的区域是一条线,而不是点。
如果您的Z曲面有不同的表达式,例如:
Z = np.exp(-X**2 - Y**2)你可能会:

在这种情况下,可以看到两个梯度在点(0, 0)中都是空的,其中曲面有一个最大值。
https://stackoverflow.com/questions/68779272
复制相似问题
腾讯云开发者

Copyright © 2013 - 2026 Tencent Cloud. All Rights Reserved. 腾讯云 版权所有
深圳市腾讯计算机系统有限公司 ICP备案/许可证号:粤B2-20090059 ![]() 粤公网安备44030502008569号
粤公网安备44030502008569号
腾讯云计算(北京)有限责任公司 京ICP证150476号 | 京ICP备11018762号