
如何创建A到B车辆沿路线移动的动画?
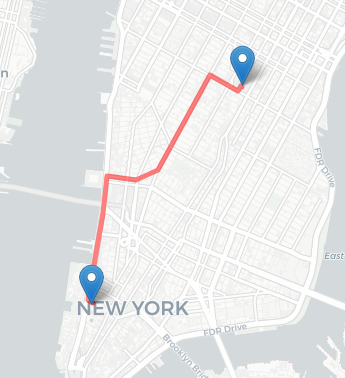
下面是使用R.中的osrm包查找从“纽约世贸中心一号”到“麦迪逊广场公园”的路线、旅行时间和旅行距离的例子(我从R中的道路路由那里学到的)。这里的旅行时间是10.37分钟。
我想要制作一个视频来进行可视化。
问:我如何创建一个汽车动画(代表一个标志)从‘一个世界贸易中心,纽约“到’麦迪逊广场公园,纽约”沿线?
理想情况下,我们应该知道每个路段的速度。但是假设车辆在两个位置之间以恒定的速度(=距离/时间)不间断地移动。
我们可以简单地使用tmap代替传单,也可以创建动画。
library(sf)
library(dplyr)
library(tidygeocoder)
library(osrm)

# 1. One World Trade Center, NYC
# 2. Madison Square Park, NYC
adresses <- c("285 Fulton St, New York, NY 10007",
            "11 Madison Ave, New York, NY 10010")

# geocode the two addresses & transform to {sf} data structure
data <- tidygeocoder::geo(adresses, method = "osm") %>%
  st_as_sf(coords = c("long", "lat"), crs = 4326)

osroute <- osrm::osrmRoute(loc = data,
                           returnclass = "sf")

summary(osroute)


library(leaflet)

leaflet(data = data) %>%
  addProviderTiles("CartoDB.Positron") %>%
  addMarkers(label = ~address) %>%
  addPolylines(data = osroute,
               label = "OSRM engine",
color = "red")回答 3
Stack Overflow用户
发布于 2021-08-24 08:51:37
作为@mrhellman提出的tmap方法的替代方案,我提供了一个基于ggplot、ggmap (用于basemap)和基于gganimate的工作流的替代方案。
我发现通过{gganimate}创建动画的结果更好,因为{gganimate}给了我更多的控制--例如,在我看来,shadow_wake很好地说明了汽车沿着这条线移动的情况。如果我没记错的话,tmap在引擎盖下使用gganimate。
ggmap不支持CartoDB基本地图--比如上面使用的正电子地图--但我发现调色剂的背景已经足够了。
请注意,ggmap并不能很好地处理ggplot2::geom_sf(),我发现将工作流转换为旧的ggplot2::geom_point()方法更容易--即提取x和y坐标并通过aes()映射它们。
由于只有一条要显示的路由,因此计算在transition_reveal()中使用的用于动画的技术变量transition_reveal()就足够了;如果需要,可以用时间维度(例如,在单个动画中显示具有不同行程时间的更多路线)代替。
library(sf)
library(dplyr)
library(tidygeocoder)
library(osrm)

# 1. One World Trade Center, NYC
# 2. Madison Square Park, NYC
adresses <- c("285 Fulton St, New York, NY 10007",
              "11 Madison Ave, New York, NY 10010")

# geocode the two addresses & transform to {sf} data structure
data <- tidygeocoder::geo(adresses, method = "osm") %>%
  st_as_sf(coords = c("long", "lat"), crs = 4326)

osroute <- osrm::osrmRoute(loc = data,
                           returnclass = "sf")

# sample osroute 50 times regularly, cast to POINT, return sf (not sfc) object
osroute_sampled <- st_sample(osroute, type = 'regular', size = 50) %>%
  st_cast('POINT') %>%
  st_as_sf()


library(ggplot2)
library(ggmap) # warning: has a naming conflict with tidygeocoder!
library(gganimate)

# ggmap does not quite like geom_sf(),
# the "old school" geom_point will be easier to work with
osroute_xy <- osroute_sampled %>%
  mutate(seq = 1:nrow(.),
         x = st_coordinates(.)[,"X"],
         y = st_coordinates(.)[,"Y"])

# basemap / the bbox depends on yer area of interest
NYC <- get_stamenmap(bbox = c(-74.05, 40.68, -73.9, 40.8),
                     zoom = 13,
                     maptype = "toner-background")

# draw a map
animation <- ggmap(NYC) +
  geom_point(data = osroute_xy,
             aes(x = x, y = y),
             color = "red",
             size = 4) +
  theme_void() +
  transition_reveal(seq) +
  shadow_wake(wake_length = 1/6)

# create animation
gganimate::animate(animation,
                   nframes = 2*(nrow(osroute_xy)+1),
                   height = 800,
                   width = 760,
                   fps = 10,
                   renderer = gifski_renderer(loop = T))

# save animation
gganimate::anim_save('animated_nyc.gif')
Stack Overflow用户
发布于 2021-08-24 09:02:27
下面是一种{mapdeck}方法,它为您提供了一个交互式地图(如传单)和动画旅行,并且可以轻松地一次处理数千次旅行

library(mapdeck)

set_token( secret::get_secret("MAPBOX") )

mapdeck(
  location = as.numeric( data[1, ]$geometry[[1]] ) ## for 'trips' you need to specify the location
  , zoom = 12
  , style = mapdeck_style("dark")
) %>%
  add_trips(
    data = sf
    , stroke_colour = "#FFFFFF" #white
    , trail_length = 12
    , animation_speed = 8
    , stroke_width = 50
)add_trips()函数接受具有Z和M维(z =海拔,m=时间)的sf直线字符串对象。因此,您可以让一个时间戳与每个坐标相结合。
library(mpadeck)
library(sfheaders)


df_route <- sfheaders::sf_to_df(osroute, fill = TRUE)

## Assume 'duration' is constant
## we want the cumulative time along the rute
df_route$cumtime <- cumsum(df_route$duration)


## and we also need a Z component.
## since we don't know the elevation, I'm setting it to '0'
df_route$elevation <- 0

## Build the 'sf' object wtih the Z and M dimensions
sf <- sfheaders::sf_linestring(
  obj = df_route
  , x = "x"
  , y = "y"
  , z = "elevation"
  , m = "cumtime"
)网站有更多的细节。
Stack Overflow用户
发布于 2021-08-24 00:46:03
用您希望拥有的点数来示例路由( LINESTRING),然后使用lapply函数来生成映射对象,并使用tmap_animate对它们进行动画化。
在上面的代码中添加:
library(tmap)
library(gifski)

# sample osroute 50 times regularly, cast to POINT, return sf (not sfc) object
osroute_sampled <- st_sample(osroute, type = 'regular', size = 50) %>%
  st_cast('POINT') %>%
  st_as_sf()


# use lapply to crate animation maps. taken from reference page:
#  https://mtennekes.github.io/tmap/reference/tmap_animation.html

m0 <- lapply(seq_along(1:nrow(osroute_sampled)), function(point){
  x <- osroute_sampled[point,]   ## bracketted subsetting to get only 1 point
  tm_shape(osroute) +            ## full route
    tm_sf() +
    tm_shape(data) +             ## markers for start/end points
    tm_markers() +
    tm_shape(x) +                ## single point
    tm_sf(col = 'red', size = 3)
})

# Render the animation
tmap_animation(m0, width = 300, height = 600, delay = 10)我已经有一段时间没有使用tmap了,所以我并不是最新的添加提供者贴片。应该不会太难将这些添加到lapply函数中。
https://stackoverflow.com/questions/68899833
复制相似问题
腾讯云开发者

Copyright © 2013 - 2026 Tencent Cloud. All Rights Reserved. 腾讯云 版权所有
深圳市腾讯计算机系统有限公司 ICP备案/许可证号:粤B2-20090059 ![]() 粤公网安备44030502008569号
粤公网安备44030502008569号
腾讯云计算(北京)有限责任公司 京ICP证150476号 | 京ICP备11018762号