
用plot_likert函数从sjPlot绘制likert标度
用plot_likert函数从sjPlot绘制likert标度
提问于 2021-09-03 13:10:29
我有字符格式的likert刻度数据,并希望使用plot_likert函数从sjPlot R包绘制它。
df1 <-
  data.frame(
  matrix(
    data = sample(x = c("Strongly Disagree", "Disagree", "Neutral", "Agree", "Strongly Agree"), size = 500, replace = TRUE),
    ncol = 5
    )
  )

head(df1)
                 X1                X2                X3                X4
1           Neutral           Neutral Strongly Disagree    Strongly Agree
2          Disagree          Disagree    Strongly Agree             Agree
3           Neutral    Strongly Agree Strongly Disagree             Agree
4           Neutral    Strongly Agree             Agree Strongly Disagree
5           Neutral           Neutral          Disagree Strongly Disagree
6 Strongly Disagree Strongly Disagree             Agree Strongly Disagree
                 X5
1          Disagree
2 Strongly Disagree
3 Strongly Disagree
4           Neutral
5 Strongly Disagree
6             Agree

library(sjPlot)

plot_likert(df1)

    Error: Can't coerce element 1 from a character to a double
In addition: There were 18 warnings (use warnings() to see them)但是,plot_likert适用于数字数据。
df2 <-
  data.frame(
  matrix(
    data = sample(x = 1:5, size = 500, replace = TRUE),
    ncol = 5
    )
  )

df2

plot_likert(df2)
帮帮忙。
回答 1
Stack Overflow用户
回答已采纳
发布于 2021-09-03 13:39:57
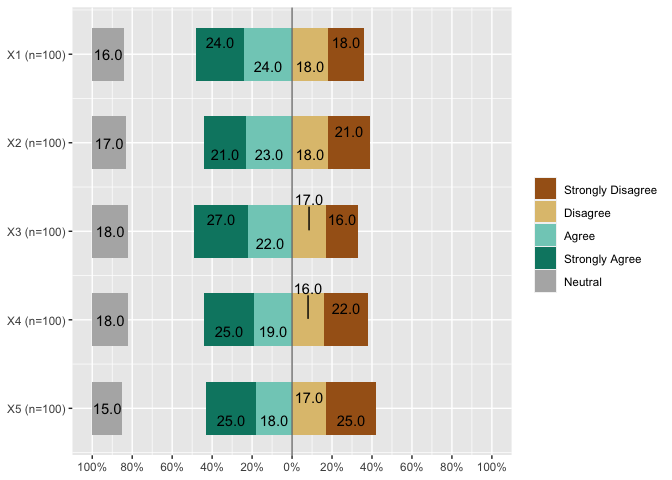
要绘制数据,必须先将character转换为ordered factors,然后才能将其传递给plot_likert。否则,plot_likert应该如何知道,如何排序您的类别。
另外,请注意,plot_likert只适用于偶数个类别(参见?plot_likert)。但是,您可以通过选项cat.neutral设置一个中性类别。
library(sjPlot)

df1 <-
  data.frame(
    matrix(
      data = sample(x = c("Strongly Disagree", "Disagree", "Neutral", "Agree", "Strongly Agree"), size = 500, replace = TRUE),
      ncol = 5
    )
  )

df1 <- dplyr::mutate_all(df1, ~ ordered(., levels = c("Strongly Disagree", "Disagree", "Neutral", "Agree", "Strongly Agree")))

plot_likert(df1, cat.neutral = 3)
页面原文内容由Stack Overflow提供。腾讯云小微IT领域专用引擎提供翻译支持
原文链接:
https://stackoverflow.com/questions/69045490
复制相关文章
相似问题
腾讯云开发者

Copyright © 2013 - 2026 Tencent Cloud. All Rights Reserved. 腾讯云 版权所有
深圳市腾讯计算机系统有限公司 ICP备案/许可证号:粤B2-20090059 ![]() 粤公网安备44030502008569号
粤公网安备44030502008569号
腾讯云计算(北京)有限责任公司 京ICP证150476号 | 京ICP备11018762号