
数据帧熔解问题与气泡图
数据帧熔解问题与气泡图
提问于 2021-09-03 07:42:01
这是我的数据
a <- dput(df)
structure(list(Category = c("KEGG Pathway", "KEGG Pathway", "KEGG Pathway",
"KEGG Pathway", "KEGG Pathway", "KEGG Pathway", "KEGG Pathway",
"KEGG Pathway", "KEGG Pathway", "KEGG Pathway", "KEGG Pathway",
"KEGG Pathway", "KEGG Pathway", "KEGG Pathway", "KEGG Pathway",
"KEGG Pathway", "Reactome Gene Sets", "Reactome Gene Sets", "Reactome Gene Sets",
"Reactome Gene Sets", "Reactome Gene Sets", "Reactome Gene Sets",
"Reactome Gene Sets", "Reactome Gene Sets", "Reactome Gene Sets",
"Reactome Gene Sets", "Reactome Gene Sets"), Description = c("Cytokine-cytokine receptor interaction",
"Cytokine-cytokine receptor interaction", "Salmonella infection",
"Rheumatoid arthritis", "Salmonella infection", "Rheumatoid arthritis",
"Toll-like receptor signaling pathway", "Toll-like receptor signaling pathway",
"Chemokine signaling pathway", "Chemokine signaling pathway",
"PI3K-Akt signaling pathway", "PI3K-Akt signaling pathway", "Rap1 signaling pathway",
"Rap1 signaling pathway", "TNF signaling pathway", "TNF signaling pathway",
"Interleukin-10 signaling", "Cytokine Signaling in Immune system",
"Chemokine receptors bind chemokines", "Signaling by GPCR", "Signaling by Interleukins",
"Peptide ligand-binding receptors", "GPCR ligand binding", "GPCR downstream signalling",
"Class A/1 (Rhodopsin-like receptors)", "Signaling by Receptor Tyrosine Kinases",
"Metabolism of nucleotides"), LogP = c(-6.6272284368, -6.6272284368,
-2.9316614282, -2.8584315312, -2.7718494704, -2.7061868255, -2.6281915791,
-2.6281915791, -2.5273777647, -2.5273777647, -3.6762135505, -3.2880356369,
-2.2646576514, -2.117278626, -3.5410827773, -3.4151337331, -8.2548924333,
-6.5328526991, -4.7978866035, -3.9736787567, -3.7112985062, -3.1255339841,
-3.0317801957, -2.6859542446, -2.6603292838, -3.2998550411, -2.690237169
)), row.names = c(NA, -27L), class = c("data.table", "data.frame"
), .internal.selfref = <pointer: 0x5642e14a3420>)
这是这样的
head(a)
       Category                            Description      LogP
1: KEGG Pathway Cytokine-cytokine receptor interaction -6.627228
2: KEGG Pathway Cytokine-cytokine receptor interaction -6.627228
3: KEGG Pathway                   Salmonella infection -2.931661
4: KEGG Pathway                   Rheumatoid arthritis -2.858432
5: KEGG Pathway                   Salmonella infection -2.771849
6: KEGG Pathway                   Rheumatoid arthritis -2.706187
在这个类别列中,我有两个独特的组,KEGG和Reactome。
所以我试着用这样的长格式融化
pcm = melt(df, id = c("Description"))

pcm$Description <- factor(pcm$Description,levels=unique(pcm$Description))

colours = c( "#A54657",  "#582630", "#F7EE7F", "#4DAA57","#F1A66A","#F26157", "#F9ECCC", "#679289", "#33658A",
             "#F6AE2D","#86BBD8")


xx = ggplot(pcm, aes(x = variable, y = Description)) +
  geom_point(aes(size = value, fill = variable), alpha = 0.75, shape = 21) +
  #scale_size_continuous(limits = c(-6, -1), range = c(1,17), breaks = c(1,10,50,75)) +
  labs( x= "", y = "", size = "p value (%)", fill = "")  +
  theme(legend.key=element_blank(),
        axis.text.x = element_text(colour = "black", size = 12, face = "bold", angle = 90, vjust = 0.3, hjust = 1),
        axis.text.y = element_text(colour = "black", face = "bold", size = 11),
        legend.text = element_text(size = 10, face ="bold", colour ="black"),
        legend.title = element_text(size = 12, face = "bold"),
        panel.background = element_blank(), panel.border = element_rect(colour = "black", fill = NA, size = 1.2),
        legend.position = "right") +
  scale_fill_manual(values = colours, guide = FALSE) +
  scale_y_discrete(limits = rev(levels(pcm$Description)))

xx
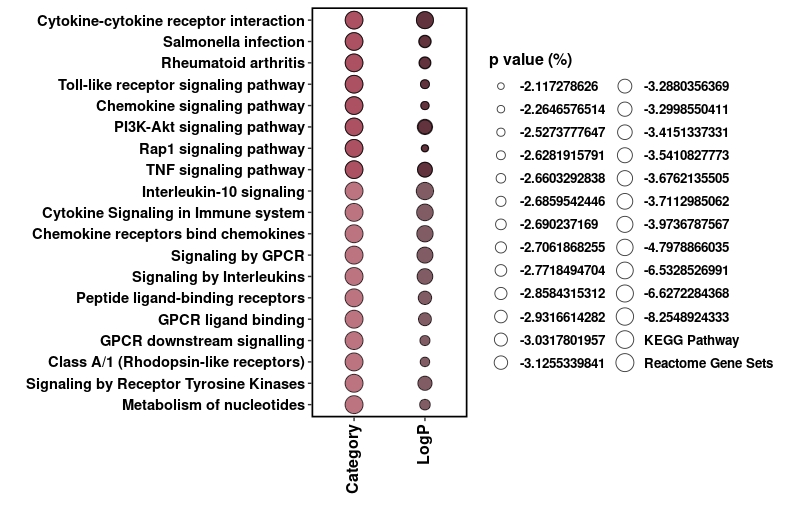
但这个我搞砸了
我需要的是在我的x轴,我只想要我的两个类别和我的y轴描述标签,我不确定,如果两个传奇的pvalue可以进去。
如有任何建议或帮助,将不胜感激。
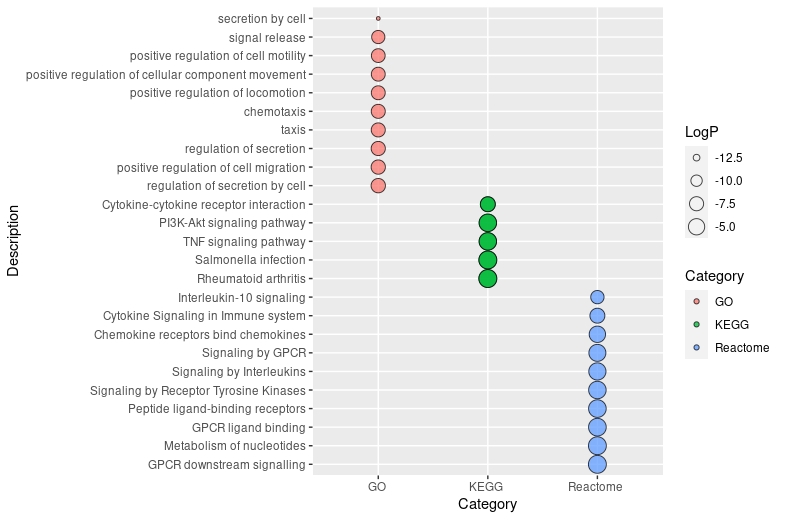
更新
d <- unique_GO %>% group_by(Category) %>% slice_min(order_by = LogP, n = 10)


df$Description <- factor(d$Description,levels=unique(df$Description))

colours = c( "#A54657",  "#582630", "#F7EE7F", "#4DAA57","#F1A66A","#F26157", "#F9ECCC", "#679289", "#33658A",
             "#F6AE2D","#86BBD8")

ggplot(df, aes(x = Category, y = Description)) +
  geom_point(aes(size = LogP, fill = Category), alpha = 0.75, shape = 21) +
scale_y_discrete(limits = rev(levels(df$Description)))
回答 1
Stack Overflow用户
回答已采纳
发布于 2021-09-03 07:46:46
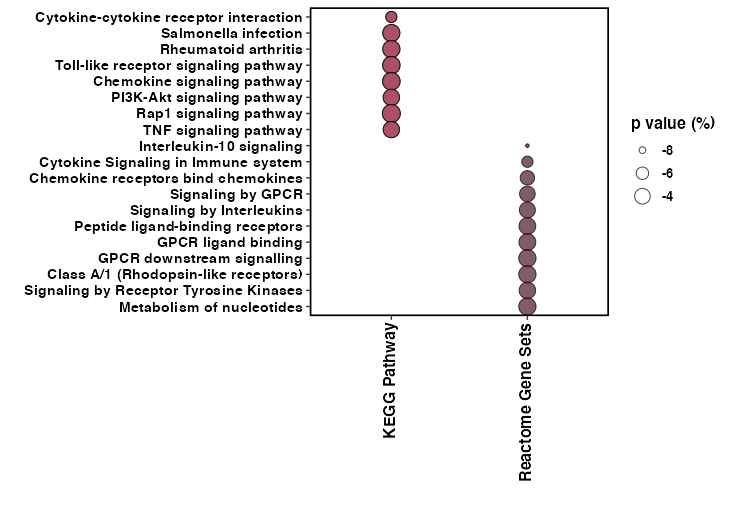
您的数据在a中已经是长格式的,ggplot可以很好地处理。
a$Description <- factor(a$Description,levels=unique(a$Description))

colours = c( "#A54657",  "#582630", "#F7EE7F", "#4DAA57","#F1A66A","#F26157", "#F9ECCC", "#679289", "#33658A",
             "#F6AE2D","#86BBD8")

ggplot(a, aes(x = Category, y = Description)) +
   geom_point(aes(size = LogP, fill = Category), alpha = 0.75, shape = 21) +
   ...
   scale_y_discrete(limits = rev(levels(a$Description)))
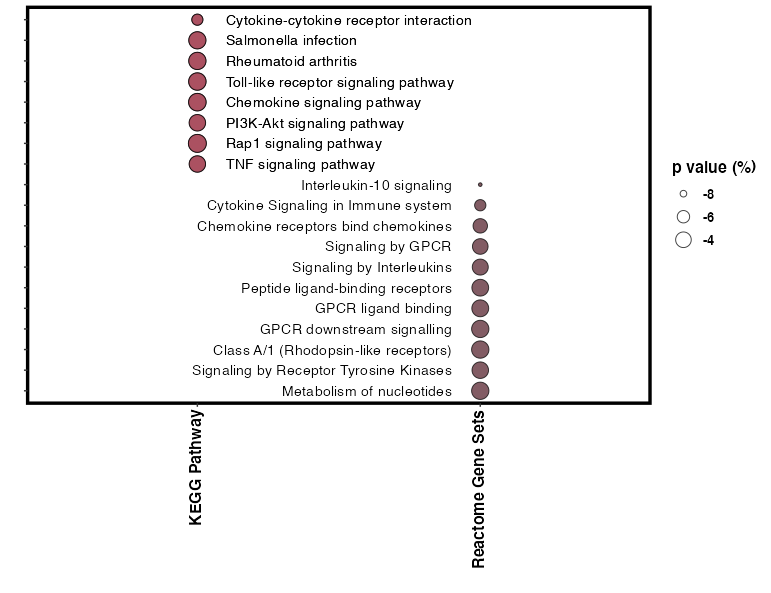
编辑
有很多方法来摆弄文字间距。这里有一种使用空白的方法:
library(ggplot2); library(dplyr)
ggplot(a, aes(x = Category, y = Description)) +
   geom_point(aes(size = LogP, fill = Category), alpha = 0.75, shape = 21) +
   #scale_size_continuous(limits = c(-6, -1), range = c(1,17), breaks = c(1,10,50,75)) +
   geom_text(data = a %>% filter(Category != "KEGG Pathway"),
             aes(label = Description), hjust = 1, nudge_x = -0.1) +
   geom_text(data = a %>% filter(Category == "KEGG Pathway"),
             aes(label = Description), hjust = 0, nudge_x = 0.1) +
   coord_cartesian(clip = "off") +

   labs( x= "", y = "", size = "p value (%)", fill = "")  +
   theme(legend.key=element_blank(),

         axis.text.x = element_text(colour = "black", size = 12, face = "bold", angle = 90, vjust = 0.3, hjust = 1),
         axis.text.y = element_blank(),
         legend.text = element_text(size = 10, face ="bold", colour ="black"),
         legend.title = element_text(size = 12, face = "bold"),
         panel.background = element_blank(), panel.border = element_rect(colour = "black", fill = NA, size = 1.2),
         legend.position = "right") +
   scale_fill_manual(values = colours, guide = FALSE) +
   scale_y_discrete(limits = rev(levels(a$Description)))
页面原文内容由Stack Overflow提供。腾讯云小微IT领域专用引擎提供翻译支持
原文链接:
https://stackoverflow.com/questions/69041206
复制相关文章
相似问题
腾讯云开发者

Copyright © 2013 - 2026 Tencent Cloud. All Rights Reserved. 腾讯云 版权所有
深圳市腾讯计算机系统有限公司 ICP备案/许可证号:粤B2-20090059 ![]() 粤公网安备44030502008569号
粤公网安备44030502008569号
腾讯云计算(北京)有限责任公司 京ICP证150476号 | 京ICP备11018762号