
按多列对Pandas Dataframe进行分组,以获得特定值
按多列对Pandas Dataframe进行分组,以获得特定值
提问于 2021-09-23 14:43:53
让我们来描述一下我的问题。
我从数据库里得到了很多数据。例如,它的内容如下:
d = [
{'Tag': 'Weight', 'Value': 15, 'Product': 'Apple', 'Year': 2019 },
{'Tag': 'Weight', 'Value': 14, 'Product': 'Apple', 'Year': 2020 },
{'Tag': 'Weight', 'Value': 16, 'Product': 'Apple', 'Year': 2021 },
{'Tag': 'Weight', 'Value': 30, 'Product': 'Banana', 'Year': 2019 },
{'Tag': 'Weight', 'Value': 32, 'Product': 'Banana', 'Year': 2020 },
{'Tag': 'Weight', 'Value': 31, 'Product': 'Banana', 'Year': 2021 },
{'Tag': 'Weight', 'Value': 120, 'Product': 'Papaya', 'Year': 2019 },
{'Tag': 'Weight', 'Value': 140, 'Product': 'Papaya', 'Year': 2020 },
{'Tag': 'Weight', 'Value': 130, 'Product': 'Papaya', 'Year': 2021 },
{'Tag': 'Price', 'Value': 0.23, 'Product': 'Apple', 'Year': 2019 },
{'Tag': 'Price', 'Value': 0.23, 'Product': 'Apple', 'Year': 2020 },
{'Tag': 'Price', 'Value': 0.24, 'Product': 'Apple', 'Year': 2021 },
{'Tag': 'Price', 'Value': 0.81, 'Product': 'Banana', 'Year': 2019 },
{'Tag': 'Price', 'Value': 0.83, 'Product': 'Banana', 'Year': 2020 },
{'Tag': 'Price', 'Value': 0.9, 'Product': 'Banana', 'Year': 2021 },
{'Tag': 'Price', 'Value': 2.31, 'Product': 'Papaya', 'Year': 2019 },
{'Tag': 'Price', 'Value': 2.29, 'Product': 'Papaya', 'Year': 2020 },
{'Tag': 'Price', 'Value': 2.41, 'Product': 'Papaya', 'Year': 2021 }
]
我使用以下命令创建一个dataframe:
df = pd.DataFrame(data = d)然后数据看起来是:
     Tag    Value   Product Year
0   Weight  15.00   Apple   2019
1   Weight  14.00   Apple   2020
2   Weight  16.00   Apple   2021
3   Weight  30.00   Banana  2019
4   Weight  32.00   Banana  2020
5   Weight  31.00   Banana  2021
6   Weight  120.00  Papaya  2019
...
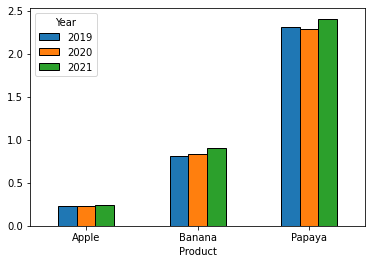
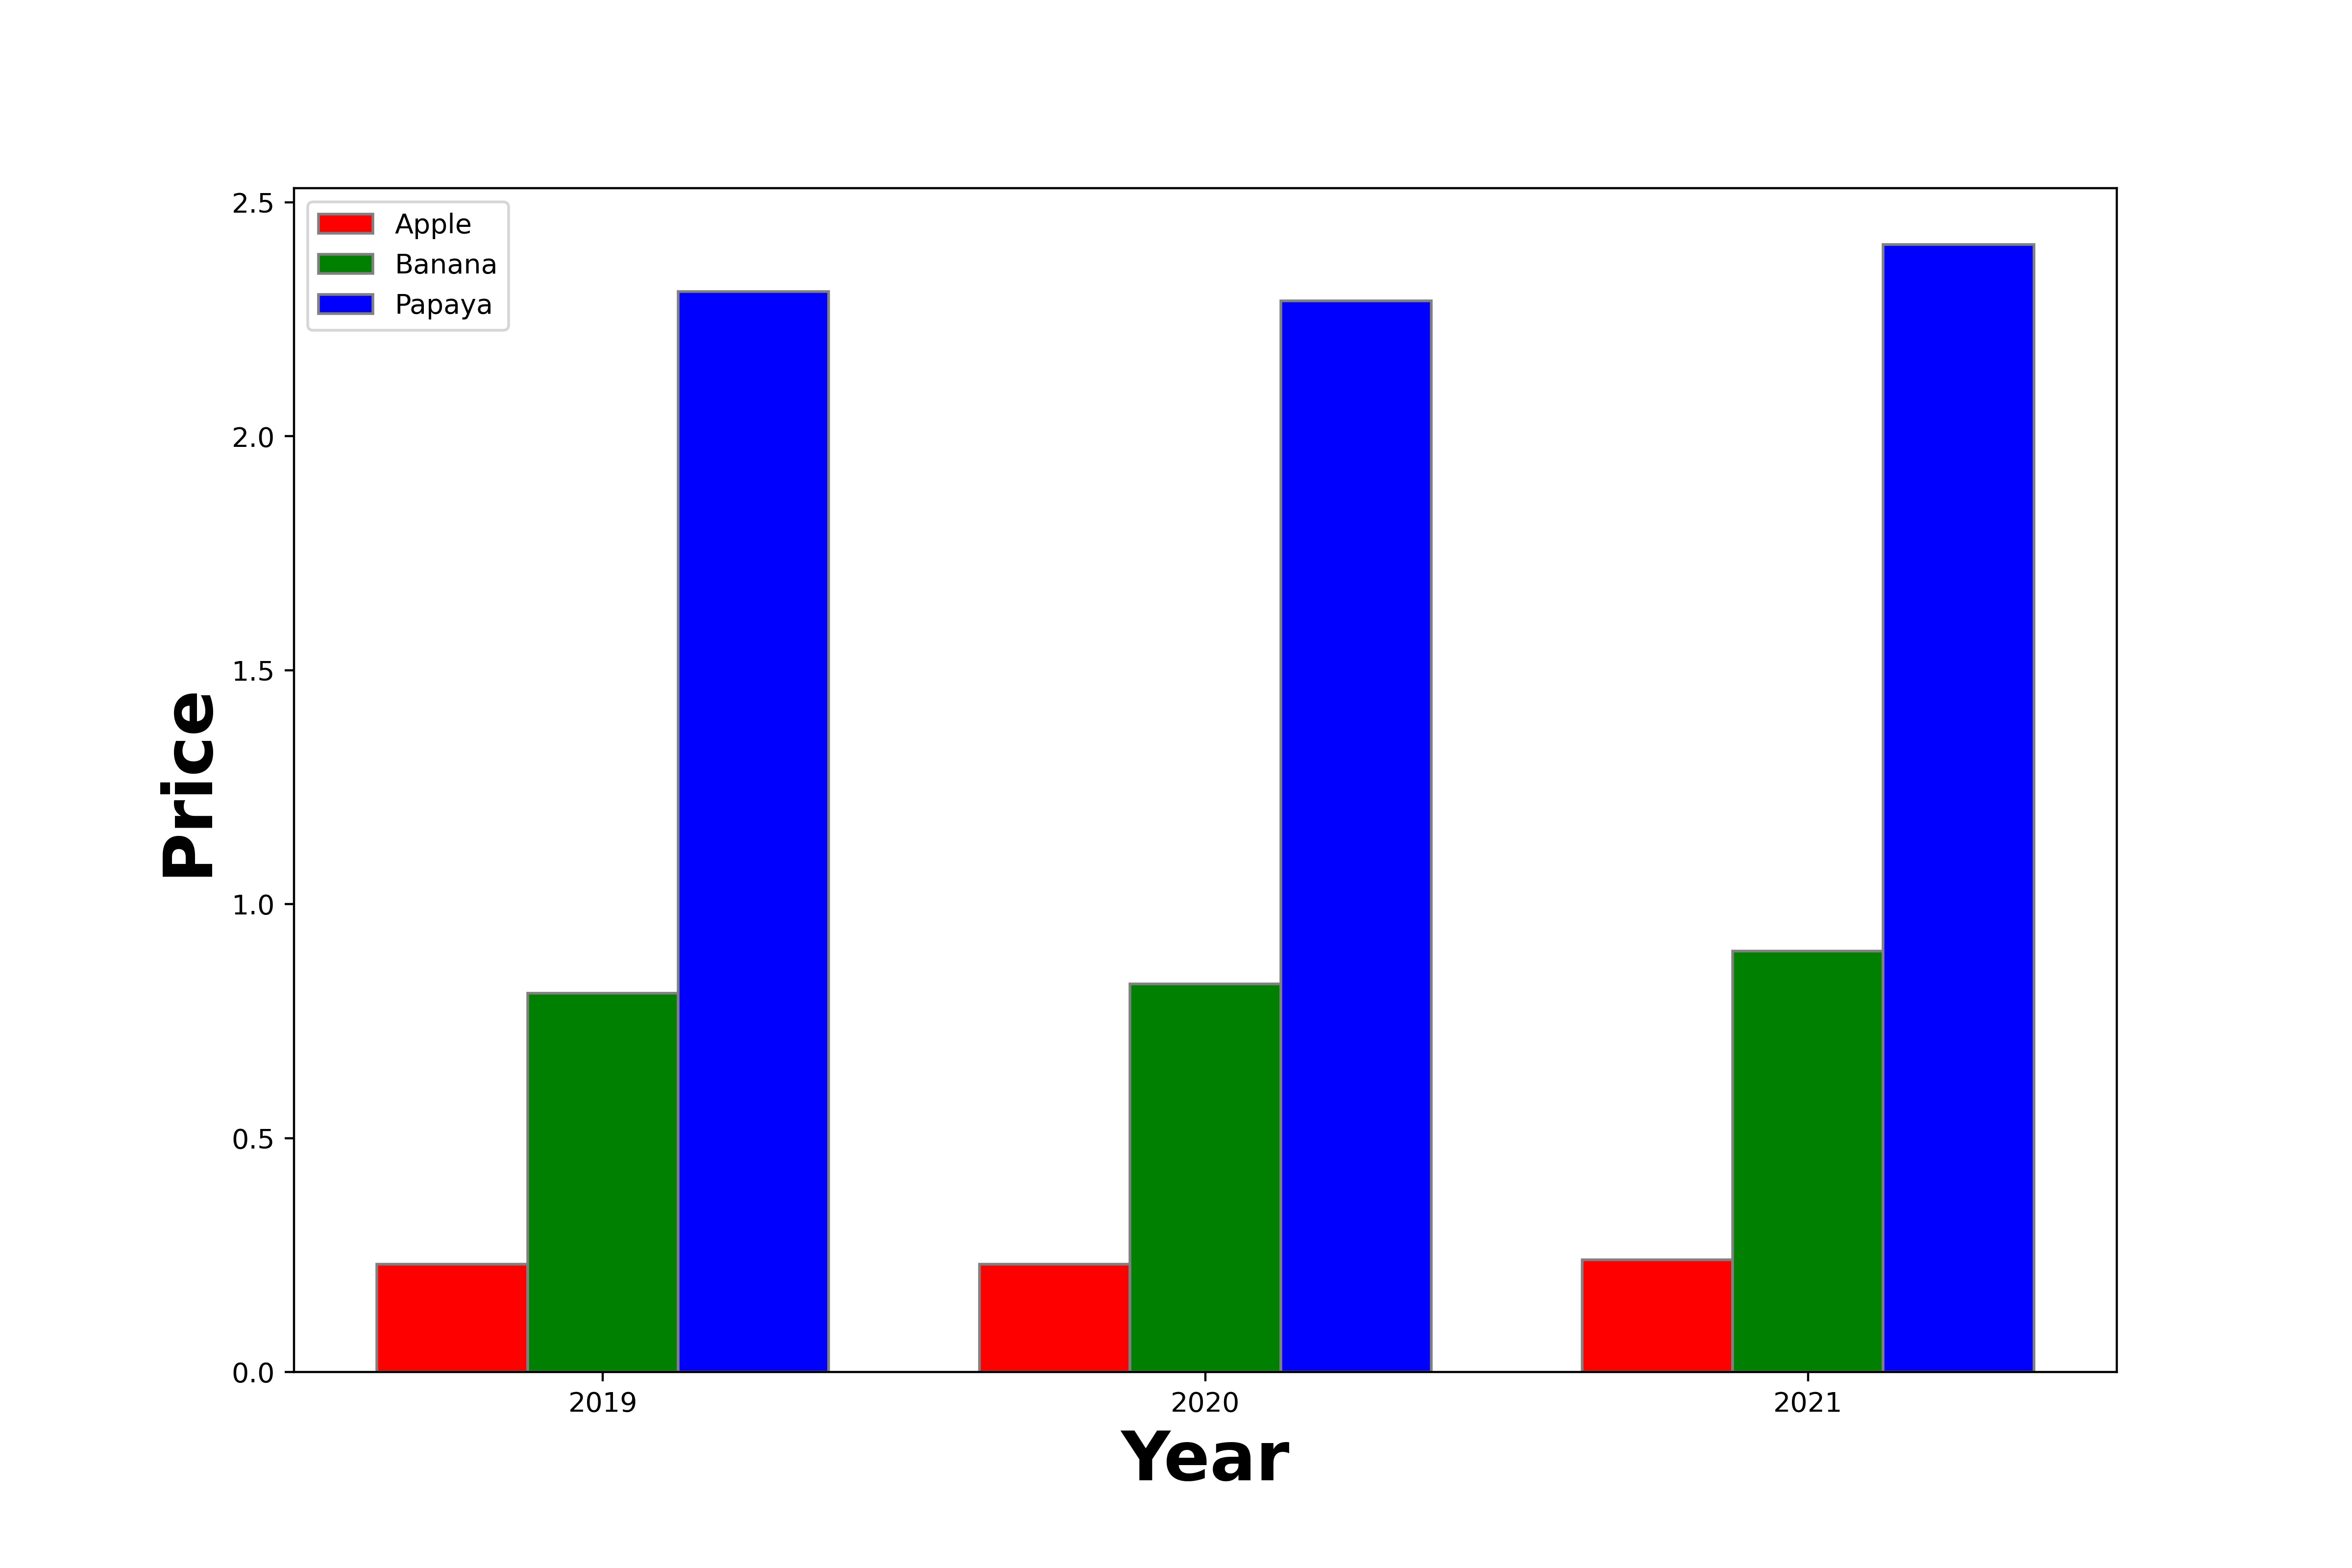
到目前为止还不错。现在我想对这些数据进行排序和过滤,以便制作出好的情节。例如,我想显示过去几年的价格(标签为== ' price ')。这意味着,在我的X轴上,我想要所有的产品,在y轴上,我有相应的价格。例如,我希望每年都有一个单独的数据集,标记为该年。在这个例子中,在条形图中,我得到了每个产品3条,每条代表一年的价格。
对熊猫来说,最好的方法是什么?
目前,我正在迭代所有的数据,找到正确的数据并填充新的数组,只为了将新创建的数组放到我的绘图图中。但这似乎不是理想的方法。
所以问题是,如何得到我的斧头的阴谋?你怎样才能以最优雅的方式解决这个问题?只和熊猫在一起?有可能吗?
我很兴奋,非常感谢
回答 2
Stack Overflow用户
回答已采纳
发布于 2021-09-23 15:12:41
将您的数据子集到'Price'行,然后使用一个pivot进行重组,这样组织就适合于绘制条形图--每个产品都有一行,每年都有一列。
dfp = (df[df['Tag'].eq('Price')]
          .pivot(index='Product', columns='Year', values='Value'))
#Year     2019  2020  2021
#Product
#Apple    0.23  0.23  0.24
#Banana   0.81  0.83  0.90
#Papaya   2.31  2.29  2.41

dfp.plot(kind='bar', rot=0, ec='k')
Stack Overflow用户
发布于 2021-09-23 15:18:58
试试这个:
import numpy as np
import matplotlib.pyplot as plt

# set width of bar
barWidth = 0.25
fig = plt.subplots(figsize =(12, 8))

# set height of bar
Apple = list(df[(df.Product=='Apple')&(df.Tag=='Price')].Value)
Banana = list(df[(df.Product=='Banana')&(df.Tag=='Price')].Value)
Papaya = list(df[(df.Product=='Papaya')&(df.Tag=='Price')].Value)

# Set position of bar on X axis
br1 = np.arange(len(Apple))
br2 = [x + barWidth for x in br1]
br3 = [x + barWidth for x in br2]

# Make the plot
plt.bar(br1, Apple, color ='r', width = barWidth,
        edgecolor ='grey', label ='Apple')
plt.bar(br2, Banana, color ='g', width = barWidth,
        edgecolor ='grey', label ='Banana')
plt.bar(br3, Papaya, color ='b', width = barWidth,
        edgecolor ='grey', label ='Papaya')

# Adding Xticks
plt.xlabel('Year', fontweight ='bold', fontsize = 25)
plt.ylabel('Price', fontweight ='bold', fontsize = 25)
plt.xticks([r + barWidth for r in range(len(Apple))],['2019','2020','2021'])

plt.legend()
plt.show()
输出:
页面原文内容由Stack Overflow提供。腾讯云小微IT领域专用引擎提供翻译支持
原文链接:
https://stackoverflow.com/questions/69302194
复制相关文章
相似问题
腾讯云开发者

Copyright © 2013 - 2026 Tencent Cloud. All Rights Reserved. 腾讯云 版权所有
深圳市腾讯计算机系统有限公司 ICP备案/许可证号:粤B2-20090059  粤公网安备44030502008569号
腾讯云计算(北京)有限责任公司 京ICP证150476号 | 京ICP备11018762号