
圆柱形条形图前5位
圆柱形条形图前5位
提问于 2021-09-28 06:33:37
如何在条形图中仅显示前5个值
import plotly.graph_objects as go

fig = go.Figure([go.Bar(x=col, y=res, text=res)])
fig.update_layout(plot_bgcolor = "white",
                    font = dict(color = "#909497"),
                    title = dict(text = "Ratio of Buyers vs Non Buyers (Master Data(MIN))"),
                    xaxis = dict(title = "Features", linecolor = "#909497"), #tick prefix is the html code for Rupee
                    yaxis = dict(title = "Ratio", tickformat = ",", linecolor = "#909497",)) #apply our custom category order
fig.update_layout(barmode='stack', xaxis={'categoryorder':'total descending'})
fig.show()回答 1
Stack Overflow用户
回答已采纳
发布于 2021-09-28 07:51:32
没有办法做到这一点,所以你将不得不处理分类和细分的熊猫,例如。以px.data.gapminder中的样本数据为例,这样的排序和细分可以是:
dfg = df.groupby(['name']).size().to_frame().sort_values([0], ascending = False).head(5).reset_index()这将改变这一局面:
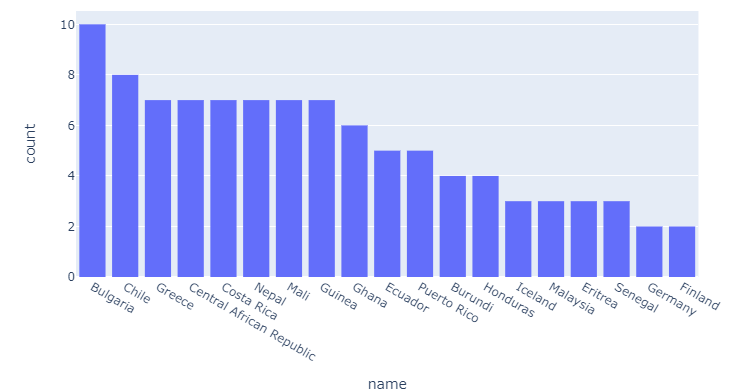
这方面:
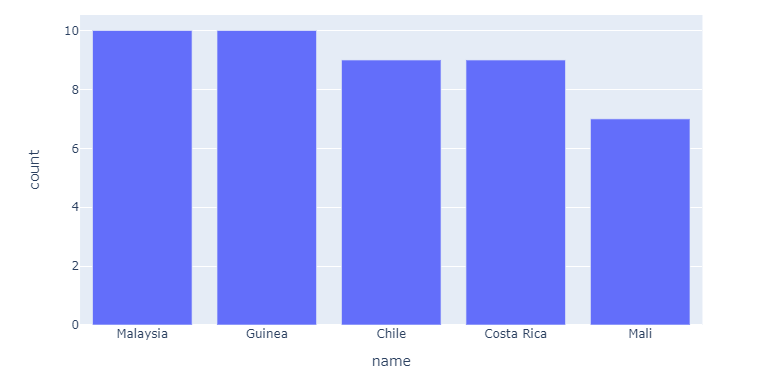
完整代码:
导入
import pandas as pd
import plotly.express as px
import random

# data sample
gapminder = list(set(px.data.gapminder()['country']))[1:20]
names = random.choices(gapminder, k=100)

# data munging
df = pd.DataFrame({'name':names})
# dfg = df.groupby(['name']).size().to_frame().sort_values([0], ascending = False).reset_index()

dfg = df.groupby(['name']).size().to_frame().sort_values([0], ascending = False).head(5).reset_index()
dfg.columns = ['name', 'count']

# plotly
fig = px.bar(dfg, x='name', y = 'count')
fig.layout.yaxis.title.text = 'count'
fig.show()如果您愿意共享一个sample of your data,我们可以更仔细地查看细节。
页面原文内容由Stack Overflow提供。腾讯云小微IT领域专用引擎提供翻译支持
原文链接:
https://stackoverflow.com/questions/69356817
复制相关文章
相似问题
腾讯云开发者

Copyright © 2013 - 2026 Tencent Cloud. All Rights Reserved. 腾讯云 版权所有
深圳市腾讯计算机系统有限公司 ICP备案/许可证号:粤B2-20090059 ![]() 粤公网安备44030502008569号
粤公网安备44030502008569号
腾讯云计算(北京)有限责任公司 京ICP证150476号 | 京ICP备11018762号