
不能使用R2和ggpmisc在两个小数位中获取ggplot2值
不能使用R2和ggpmisc在两个小数位中获取ggplot2值
提问于 2021-09-27 06:41:49
我很抱歉,我不知道如何在这里寻求帮助时,如何使可复制的例子。因此,我将提供下面的代码和数据;如果您可以查看,请在这里提供<350 KB (data:https://easyupload.io/1r5xuo)。
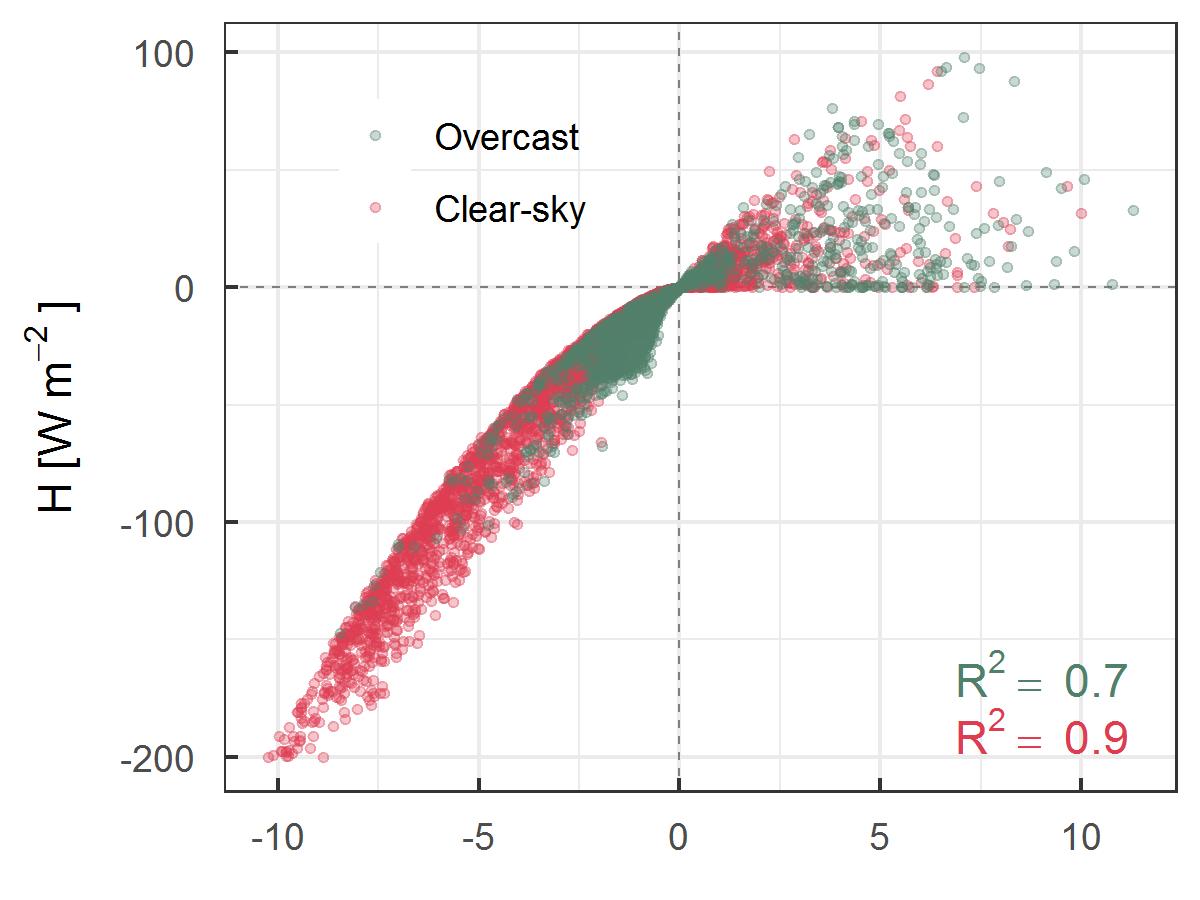
我的问题是:我想要两个R2的十进制值(如附图所示),即使我使用了digits=2,也无法使用ggpmisc的stat_fit_glance()函数,但它只显示了一个(R2=0.7和R2=0.9),可能是因为1小数后的值是零(见图中的图)。
但是,我想让他们成为R2=0.70和R2=0.90.
有人能帮我解决这个问题吗。
library(ggplot2)
library(ggpmisc)
library(dplyr)
library(openxlsx)
library(ggpubr)

# data
data_all      <- read.xlsx("./DJFMA_new_files/djfma_hourly_clear_overcast_scatter.xlsx")
colnames(data_all)[1] <- "h"
colnames(data_all)[2] <- "le"
colnames(data_all)[3] <- "ta_ts"
colnames(data_all)[4] <- "q_qRS"

# filter
data_clear <- data_all %>%
  filter(type == "Clear-sky")
data_over <- data_all %>%
  filter(type == "Overcast")

# Formula
formula1 <- y ~ x

# Plot
ggplot(data=data_all, aes(x=ta_ts, y=h, color=type)) +
  geom_hline(yintercept=0, linetype="dashed", color = "grey50", size=.3) +
  geom_vline(xintercept=0, linetype="dashed", color = "grey50", size=.3) +
  geom_point(alpha=0.3, size=1.5, shape=20) +
  labs(x=NULL,
       y=expression("H"~ "[W" ~ m^-2~"]")) +
  scale_colour_manual("",values = c("Overcast"="#51806a","Clear-sky"="#DD3C51")) +
  theme_bw() +
  theme(legend.position = c(.25, .85),
        legend.background = element_rect(fill = "transparent"),
        axis.ticks.length=unit(-0.12, "cm"),
        axis.text.y = element_text(margin=margin(5,7,5,5,"pt")),
        axis.text.x = element_text(margin=margin(7,5,5,5,"pt"))) +
  stat_fit_glance(method = 'lm',
                  method.args = list(formula = formula1),
                  #geom = 'text',
                  label.y = "bottom",
                  label.x = "right",
                  aes(label = paste("R^2 ==", round(..r.squared.., digits = 2),
                                    sep = "~")),
                  parse=TRUE)
样本图
回答 2
Stack Overflow用户
回答已采纳
发布于 2021-09-30 00:42:54
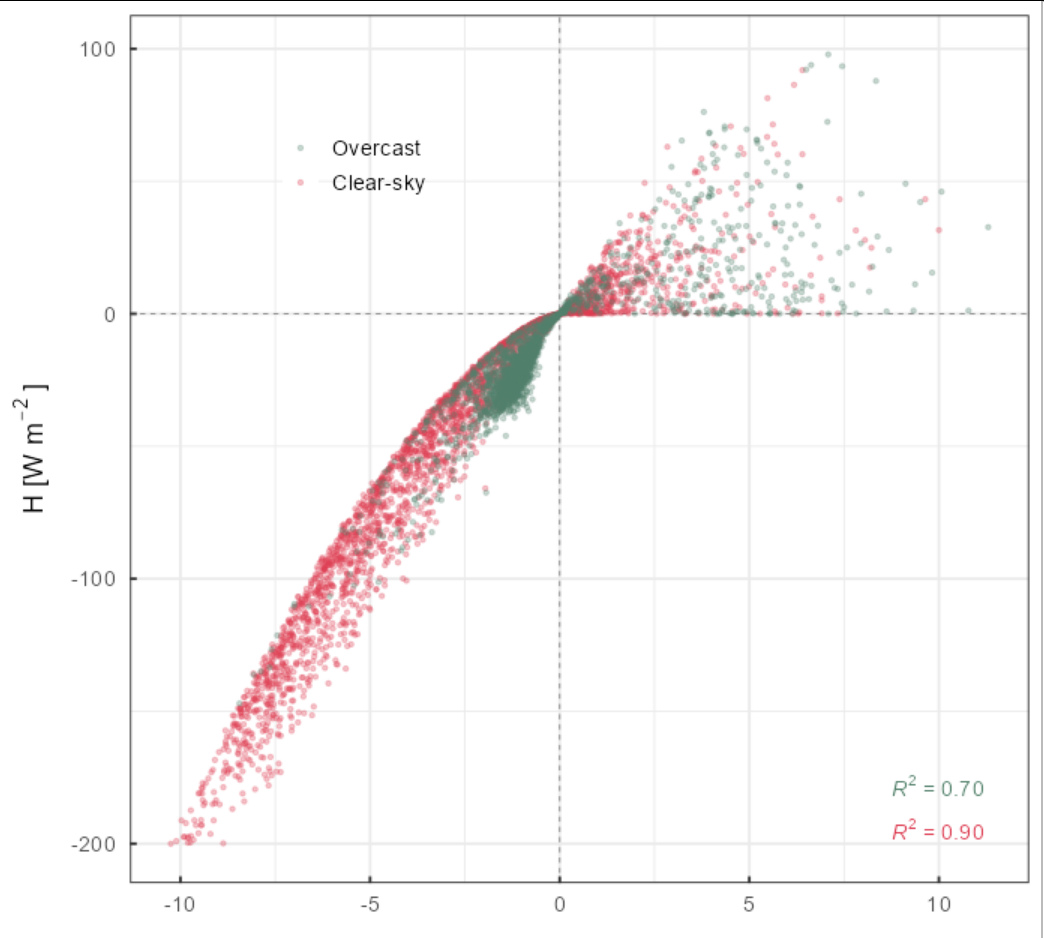
使用stat_poly_eq()可以很容易地调整数字的数量。这是使用当前版本的'ggpmisc‘从CRAN。我最近更新了代码,以便不删除尾随零。
library(ggpmisc)
library(dplyr)
library(openxlsx)

# data
data_all   <- read.xlsx("./R bits and pieces/djfma_hourly_clear_overcast_scatter.xlsx")
colnames(data_all)[1] <- "h"
colnames(data_all)[2] <- "le"
colnames(data_all)[3] <- "ta_ts"
colnames(data_all)[4] <- "q_qRS"

# filter
data_clear <- data_all %>%
  filter(type == "Clear-sky")
data_over <- data_all %>%
  filter(type == "Overcast")

# Plot
ggplot(data=data_all, aes(x=ta_ts, y=h, color=type)) +
  geom_hline(yintercept=0, linetype="dashed", color = "grey50", size=.3) +
  geom_vline(xintercept=0, linetype="dashed", color = "grey50", size=.3) +
  geom_point(alpha=0.3, size=1.5, shape=20) +
  labs(x=NULL,
       y=expression("H"~ "[W" ~ m^-2~"]")) +
  scale_colour_manual("",values = c("Overcast"="#51806a","Clear-sky"="#DD3C51")) +
  theme_bw() +
  theme(legend.position = c(.25, .85),
        legend.background = element_rect(fill = "transparent"),
        axis.ticks.length=unit(-0.12, "cm"),
        axis.text.y = element_text(margin=margin(5,7,5,5,"pt")),
        axis.text.x = element_text(margin=margin(7,5,5,5,"pt"))) +
  stat_poly_eq(label.y = "bottom",
               label.x = "right",
               rr.digits = 2)
Stack Overflow用户
发布于 2021-09-27 07:17:50
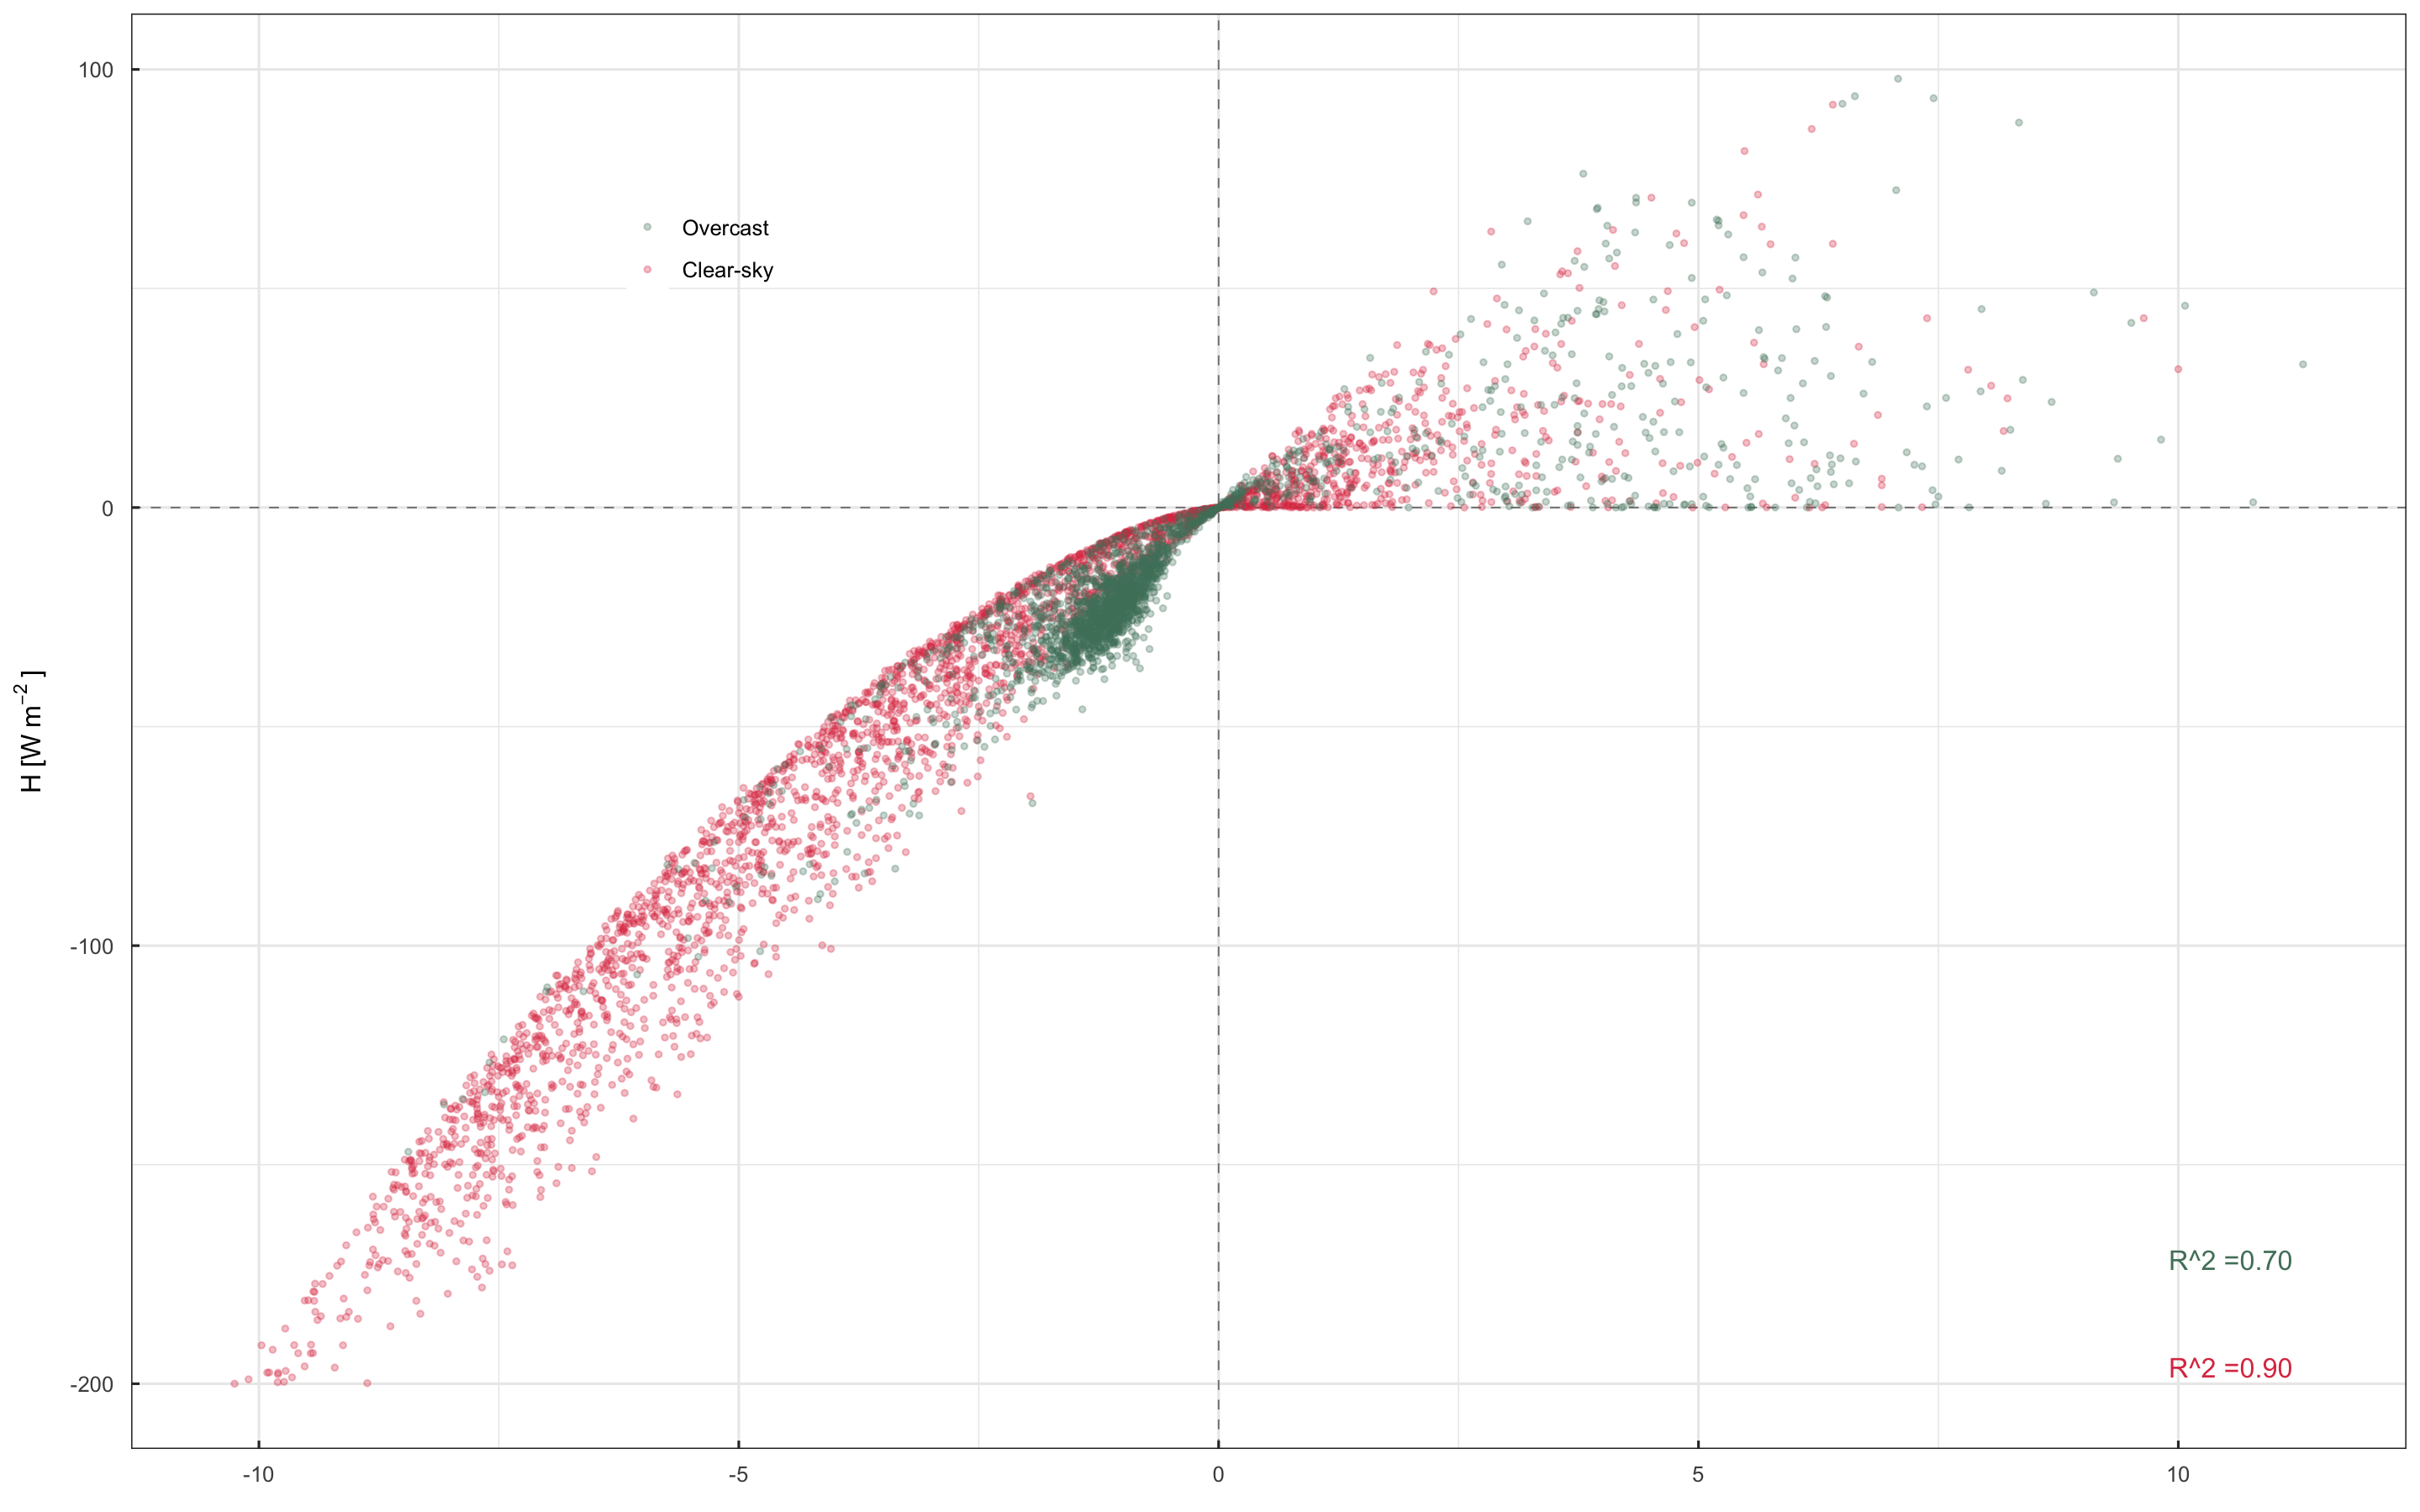
我们可以用round包装format,并使用简单的paste0将它们组合起来。这里需要记住的一件事是format的输出类型是character。
示例:
> format(round(0.70, 2), nsmall = 2)
[1] "0.70"
> typeof(format(round(0.70, 2), nsmall = 2))
[1] "character"
解决方案(只有最终的情节):
ggplot(data=data_all, aes(x=ta_ts, y=h, color=type)) +
  geom_hline(yintercept=0, linetype="dashed", color = "grey50", size=.3) +
  geom_vline(xintercept=0, linetype="dashed", color = "grey50", size=.3) +
  geom_point(alpha=0.3, size=1.5, shape=20) +
  labs(x=NULL,
       y=expression("H"~ "[W" ~ m^-2~"]")) +
  scale_colour_manual("",values = c("Overcast"="#51806a","Clear-sky"="#DD3C51")) +
  theme_bw() +
  theme(legend.position = c(.25, .85),
        legend.background = element_rect(fill = "transparent"),
        axis.ticks.length=unit(-0.12, "cm"),
        axis.text.y = element_text(margin=margin(5,7,5,5,"pt")),
        axis.text.x = element_text(margin=margin(7,5,5,5,"pt"))) +
  stat_fit_glance(method = 'lm',
                  method.args = list(formula = formula1),
                  #geom = 'text',
                  label.y = "bottom",
                  label.x = "right",
                  aes(label = paste0("R^2 =", format(round(..r.squared.., digits = 2), nsmall = 2))))
页面原文内容由Stack Overflow提供。腾讯云小微IT领域专用引擎提供翻译支持
原文链接:
https://stackoverflow.com/questions/69342237
复制相关文章
相似问题
腾讯云开发者

Copyright © 2013 - 2026 Tencent Cloud. All Rights Reserved. 腾讯云 版权所有
深圳市腾讯计算机系统有限公司 ICP备案/许可证号:粤B2-20090059 ![]() 粤公网安备44030502008569号
粤公网安备44030502008569号
腾讯云计算(北京)有限责任公司 京ICP证150476号 | 京ICP备11018762号