
这个python集成方案与解析表达式匹配吗?
这个python集成方案与解析表达式匹配吗?
提问于 2021-10-06 15:37:57
根据黄的原稿
https://arxiv.org/pdf/1401.4211.pdf
边际Hibert谱由以下几个方面给出:
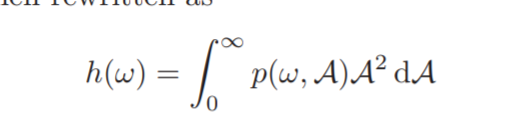
其中A = A(w,t) (即a函数时间和频率)和p(w,A)为P(ω,A)的联合概率密度函数。
I试图用plt.hist2d 2来估计联合概率密度(plt.hist2d 2)用和表示的积分。
我使用的代码如下所示:
IA_flat1  = np.ravel(IA)       ### Turn matrix to 1 D array
IF_flat1  = np.ravel(IF)       ### Here IA corresponds to A

IF_flat  = IF_flat1[(IF_flat1>min_f) & (IF_flat1<fs)]   ### Keep only desired frequencies
IA_flat  = IA_flat1[(IF_flat1>min_f) & (IF_flat1<fs)]   ### Keep IA that correspond to desired frequencies

### return the Joint probability density
Pjoint,f_edges, A_edges,_ = plt.hist2d(IF_flat,IA_flat,bins=[bins_F,bins_A], density=True)
plt.close()

n1 = np.digitize(IA_flat, A_edges).astype(int)          ### Return the indices of the bins to which
n2 = np.digitize(IF_flat, f_edges).astype(int)          ### each value in input array belongs.

### define integration function
from numba import jit, prange   ### Numba is added for speed
@jit(nopython=True, parallel= True)
def get_int(A_edges, Pjoint ,IA_flat, n1, n2):

    dA = np.diff(A_edges)[0]                     ### Find dx for integration
    sum_h = np.zeros(np.shape(Pjoint)[0])        ### Intitalize array

    for j in prange(np.shape(Pjoint)[0]):
        h = np.zeros(np.shape(Pjoint)[1])        ### Intitalize array
        for k in prange(np.shape(Pjoint)[1]):
            needed = IA_flat[(n1==k) & (n2==j)]         ### Keep only the elements of arrat that
                                                        ### are related to PJoint[j,k]

            h[k]   = Pjoint[j,k]*np.nanmean(needed**2)*dA  ### Pjoint*A^2*dA
        sum_h[j]   = np.nansum(h)                       ### Sum_{i=0}^{N}(Pjoint*A^2*dA)
    return sum_h

### Now run previously defined function
sum_h = get_int(A_edges, Pjoint ,IA_flat, n1, n2)
1) --我不确定一切都是正确的。对于我可能做错了什么,有什么建议或评论吗?2)是否有办法使用早期的集成方案来做同样的事情?
回答 1
Stack Overflow用户
发布于 2021-10-06 16:54:37
您可以从二维直方图中提取概率,并将其用于集成:
# Added some numbers to have something to run
import numpy as np
import matplotlib.pyplot as plt
IA = np.random.rand(100,100)
IF = np.random.rand(100,100)
bins_F = np.linspace(0,1,20)
bins_A = np.linspace(0,1,100)
min_f = 0
fs = 1.0


IA_flat1  = np.ravel(IA)       ### Turn matrix to 1 D array
IF_flat1  = np.ravel(IF)       ### Here IA corresponds to A

IF_flat  = IF_flat1[(IF_flat1>min_f) & (IF_flat1<fs)]   ### Keep only desired frequencies
IA_flat  = IA_flat1[(IF_flat1>min_f) & (IF_flat1<fs)]   ### Keep IA that correspond to desired frequencies

### return the Joint probability density
Pjoint,f_edges, A_edges,_ = plt.hist2d(IF_flat,IA_flat,bins=[bins_F,bins_A], density=True)

f_values = (f_edges[1:]+f_edges[:-1])/2
A_values = (A_edges[1:]+A_edges[:-1])/2
dA = A_values[1]-A_values[0] # for the integral

#Pjoint.shape (19,99)

h = np.zeros(f_values.shape)
for i in range(len(f_values)):
    f = f_values[i]

    # column of the histogram with frequency f, probability
    p = Pjoint[i]

    # summatory equivalent to the integral
    integral_result = np.sum(p*A_values**2*dA )
    h[i] = integral_result

plt.figure()
plt.plot(f_values,h)页面原文内容由Stack Overflow提供。腾讯云小微IT领域专用引擎提供翻译支持
原文链接:
https://stackoverflow.com/questions/69468676
复制相关文章
相似问题
腾讯云开发者

Copyright © 2013 - 2026 Tencent Cloud. All Rights Reserved. 腾讯云 版权所有
深圳市腾讯计算机系统有限公司 ICP备案/许可证号:粤B2-20090059 ![]() 粤公网安备44030502008569号
粤公网安备44030502008569号
腾讯云计算(北京)有限责任公司 京ICP证150476号 | 京ICP备11018762号