
python中的Matplotlib连接点
python中的Matplotlib连接点
提问于 2021-10-08 16:16:25
我所需要的连接点的可能方法是什么?
这是我的代码的一部分,让你理解我的意思:
x = [0, 5, 10, 15, 100, 105, 110, 115]
y = [15, 10, 5, 0, 115, 110, 105, 100]
plt.figure(figsize=(5, 5))

plt.xlim(-1, 120)
plt.ylim(-1, 120)
plt.grid()

plt.plot(x, y, 'og-')
拥有这个:
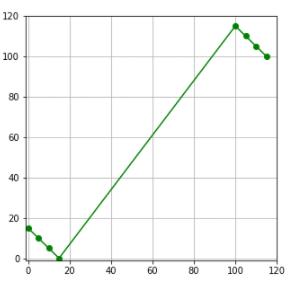
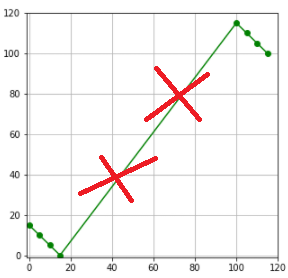
但我必须把这些分组点从(0, 15)连接到(15, 0),把(100, 115)连接到(115, 100)。我不需要点之间的长连接:(15, 0)到(100, 115)
有人能帮我找到解决这个问题的办法吗?
回答 2
Stack Overflow用户
发布于 2021-10-08 16:30:34
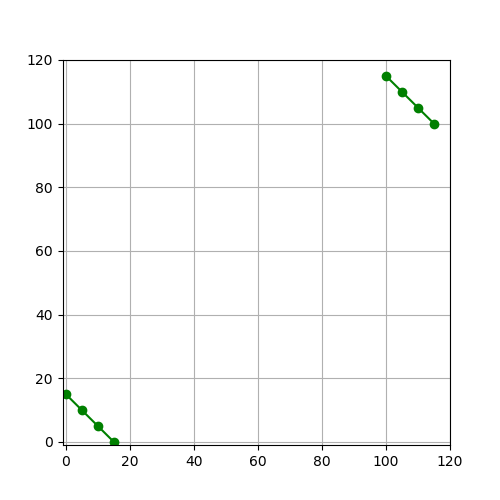
画出你想要的线,不要画你不想画的线:
from matplotlib import pyplot as plt
#x = [0, 5, 10, 15, 100, 105, 110, 115]
#y = [15, 10, 5, 0, 115, 110, 105, 100]

plt.figure(figsize=(5, 5))

plt.xlim(-1, 120)
plt.ylim(-1, 120)
plt.grid()

x1 = [0, 5, 10, 15]
y1 = [15, 10, 5, 0]

x2 = [100, 105, 110, 115]
y2 = [115, 110, 105, 100]


plt.plot(x1, y1, 'og-')
plt.plot(x2,y2, 'og-')

plt.show()
输出:
Stack Overflow用户
发布于 2021-10-08 17:17:54
如果您有一个很长的x-数组,可以将numpy的np.diff与np.nonzero结合起来计算索引。np.diff将计算随后的差异,这些差异可以与阈值进行比较。np.nonzero将返回True中比较结果的所有索引。通过循环遍历这些索引,您可以分别绘制每个部分。
from matplotlib import pyplot as plt
import numpy as np
x = [0, 5, 10, 15, 100, 105, 110, 115]
y = [15, 10, 5, 0, 115, 110, 105, 100]
threshold = 20
indices = np.nonzero(np.diff(x) >= threshold)[0] + 1
for i0, i1 in zip(np.append(0, indices), np.append(indices, len(x))):
plt.plot(x[i0:i1], y[i0:i1], '-go')
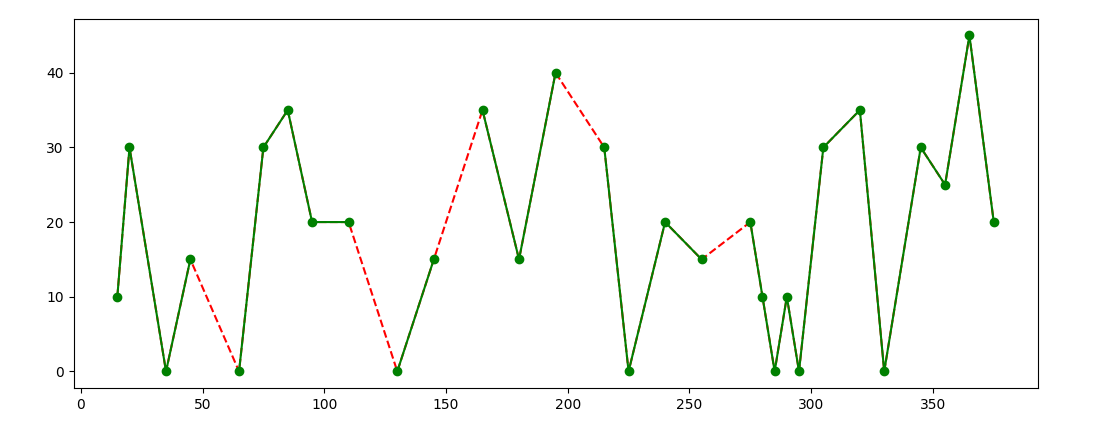
plt.show()下面是一个更详细的例子:
from matplotlib import pyplot as plt
import numpy as np

N = 30
x = (np.random.randint(1, 5, N) * 5).cumsum()
y = np.random.randint(0, 10, N) * 5
plt.plot(x, y, 'r--') # this is how the complete line would look like
threshold = 20
indices = np.nonzero(np.diff(x) >= threshold)[0] + 1
for i0, i1 in zip(np.append(0, indices), np.append(indices, len(x))):
    plt.plot(x[i0:i1], y[i0:i1], '-go')
plt.show()
页面原文内容由Stack Overflow提供。腾讯云小微IT领域专用引擎提供翻译支持
原文链接:
https://stackoverflow.com/questions/69498895
复制相关文章
相似问题
腾讯云开发者

Copyright © 2013 - 2026 Tencent Cloud. All Rights Reserved. 腾讯云 版权所有
深圳市腾讯计算机系统有限公司 ICP备案/许可证号:粤B2-20090059 ![]() 粤公网安备44030502008569号
粤公网安备44030502008569号
腾讯云计算(北京)有限责任公司 京ICP证150476号 | 京ICP备11018762号