
图形绘制颜色
我试图绘制一个RGB值与颜色的关系图,如这个:
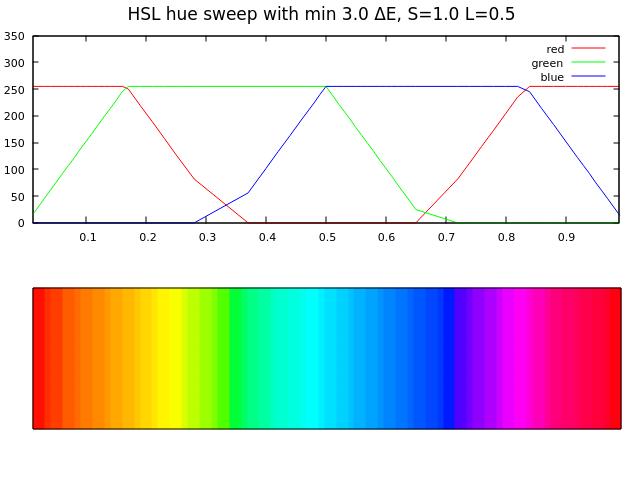
我的方法是基于http://gnuplot.sourceforge.net/demo/pm3dcolors.html的
对此,重要的是能够正确地显示任意数量的颜色,与一个情节排列。
在上面的图像中,你可以看到颜色之间奇怪的重叠,并且有不同的宽度,而且它与图形不完全一致。
这篇文章的其余部分展示了让它看起来怪异所需的最低限度。
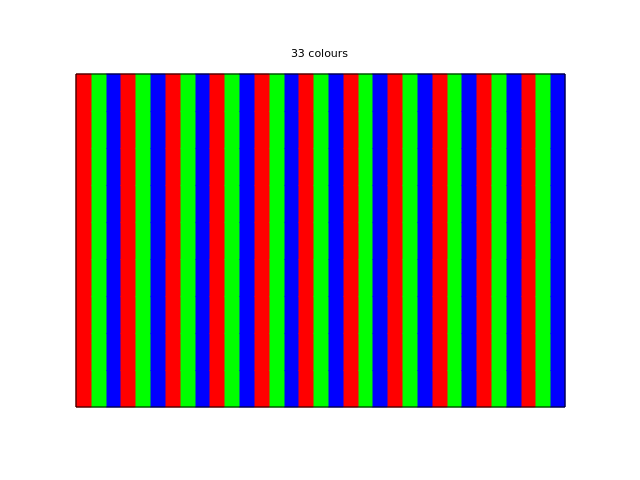
我发现它在33种颜色之后就开始搞砸了。
#!/usr/bin/env gnuplot

set format cb "%3.1f"

set style function pm3d
set view map scale 1

unset xtics
unset ytics
unset ztics
unset colorbox
unset key


set title "33 colours"
set palette model RGB
set palette file "-"
1 0 0
0 1 0
0 0 1
... repeat many times ...
1 0 0
0 1 0
0 0 1
e
set palette maxcolors 33
g(x)=x
splot g(x)

pause mouse any "press the any key to exit gnuplot
这是33色及以下颜色的情况:
- :
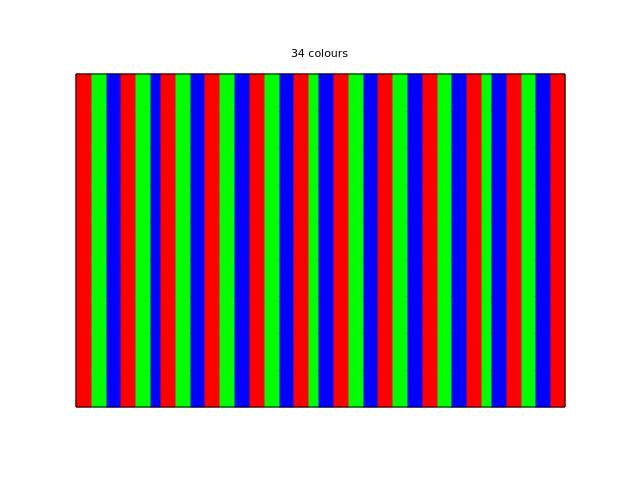
- 这是34的情况(中间的绿色不太宽):
- ,如果我们上升到66,你会看到更多的错误:
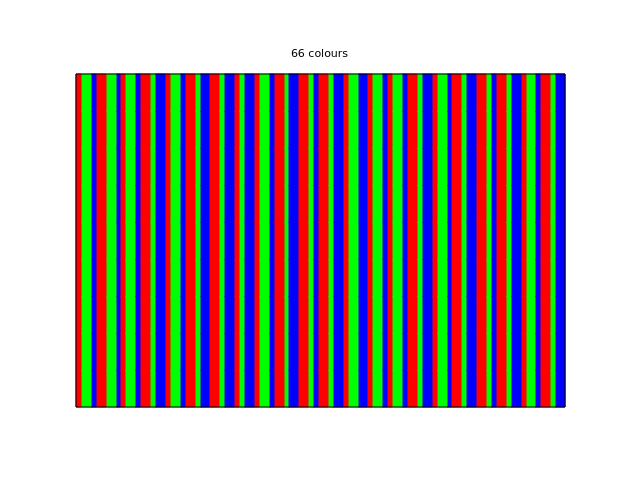
所以总的来说,这显然是对gnuplot的滥用。
还有其他更好的方法吗?如果没有,我应该如何进行调试?
我正在运行debian上debian repos的gnuket5.4补丁级1。
谢谢你的建议。
编辑:
我掉进了XY问题的陷阱。我希望问题中的第一个图形没有奇怪的东西,比如你可以看到不同的颜色宽度,而它们都应该是相同的宽度。我问了一下,我找到了什么最低限度的方法来展示我在设置调色板上看到的奇怪的东西。
我当前的输入数据如下所示:
Hue, Red, Green, Blue
0.0100, 255,  15,   0
0.0300, 255,  46,   0
0.0400, 255,  61,   0
0.0600, 255,  92,   0
0.0700, 255, 107,   0
...我生成这个情节的脚本是http://ix.io/3BE2
回答 2
Stack Overflow用户
发布于 2021-10-13 23:20:13
替代答案试图解决修改后的问题
经修改的问题:
感谢您的回复,但是“显示任意数量的颜色”,我的意思是我有一个颜色列表,我想显示它们,我没有方法将它们表示为一个函数。
# snippet of code from your attachment
set palette file 'plotData/rgb.csv' using (($2/255)):(($3/255)):(($4)/255)
set palette maxcolors system("wc -l plotData/rgb.csv | sed 's/ .*//'")

g(x)=x
splot g(x)
首先,我要指出这一办法的一些问题。我仍然不太明白输出的需求是什么,但我收集的部分问题是,它没有产生一组与调色板颜色数量相匹配的均匀间隔的区域。这是可以理解的因为
- 只通过计算外部文件中的行数来知道颜色的数目。
- --
splot F(x)生成的沿x的填充间隔的数目由set samples确定,它与Ncol没有内在的联系。 - 可以尝试通过表示
set samples Ncol对这两者进行对齐,但这仍然允许沿x轴的间隔边界与沿颜色轴cb的间隔边界不匹配。也许您可以通过修复set xrange [A:B]; set cbrange [A:B]来解决这个问题,但是它需要预先知道限值A和B。而且,在大多数应用程序中,x上理想的空间分辨率很可能要比索引调色板所支持的颜色数大得多。
我建议你真的不想为你的案子配调色板。你只想要RGB颜色值。下面是基于上面代码片段的两个变体
# convert file of numerical RGB components (0-255) to 24-bit hex representation
# $RGBtable will be a datablock containing Ncol string values
set table $RGBtable
plot 'rgbvalues.csv' using (sprintf("0x%2x%2x%2x", $2, $3, $4)) with table
unset table
Ncol = |$RGBtable|
# create an array containing the same set of colors as integer values
array RGBarray[Ncol]
do for [i=1:Ncol] { RGBarray[i] = int($RGBtable[i]) }
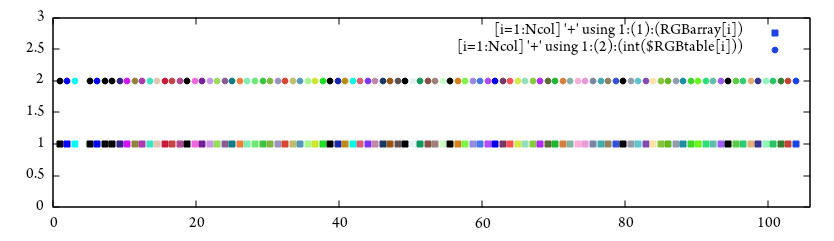
# Now we can use either the string form or the integer form to plot with.
# I still don't understand exactly what it is you are plotting, but here
# is an example using either the datablock or the array to access colors
set xrange [0 : Ncol+1]
set yrange [0 : 3]
plot sample [i=1:Ncol] '+' using 1:(1):(RGBarray[i]) with points pt 5 lc rgb variable, \
[i=1:Ncol] '+' using 1:(2):(int($RGBtable[i])) with points pt 7 lc rgb variable
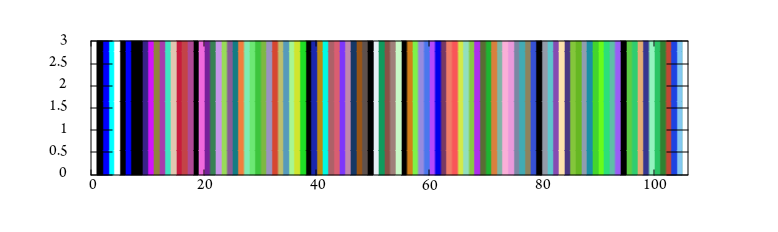
最后,这里有一些类似的东西,使用高分辨率的沿水平方向的采样,但从1:Ncol范围内的积分值中分离出一组颜色。请注意,using说明符字段3中的标称z值与此图无关,因为颜色信息是按照lc rgb variable的要求从字段4中分离而来的。
set view map
set sample 999
set urange [1:Ncol]
splot '++' using 1:2:(0):(RGBarray[int($1)]) with pm3d lc rgb variable
Stack Overflow用户
发布于 2021-10-11 22:28:38
如果我正确地理解了您尝试过的事情的描述,它们都是基于调色板定义选项set palette defined的。这在本质上受制于范围内插工件,尽管随着调色板定义中使用的增量数量的增加,工件变得不那么明显了。
由于您的主要目标是“能够正确显示任意数量的颜色”,您可能会更好地使用另一种方法来定义调色板,一种基于RGB组件的一组连续函数的方法。您可以使用而不是来使用set palette maxcolors,因为该命令的全部目的是将调色板限制为一组离散的颜色,而不是连续体。
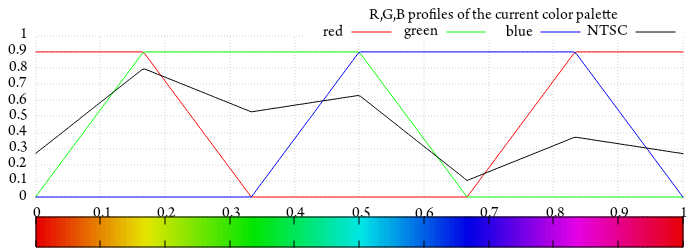
一个预定义的选项是使用set palette cubehelix,它使用一组固定的连续函数,但允许您调整各种控制参数。例如,set palette cubehelix start 0.15 cycles 1.0 saturation 1.0生成下面的调色板。然而,这个调色板家族的一个定义属性是,强度从0到1,你可能不想要。
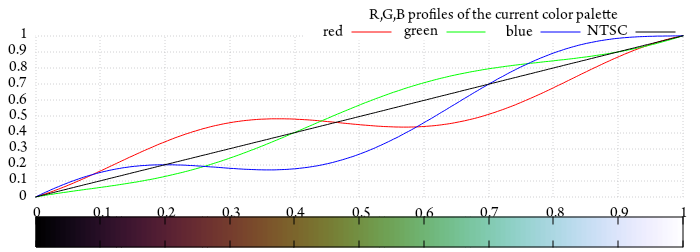
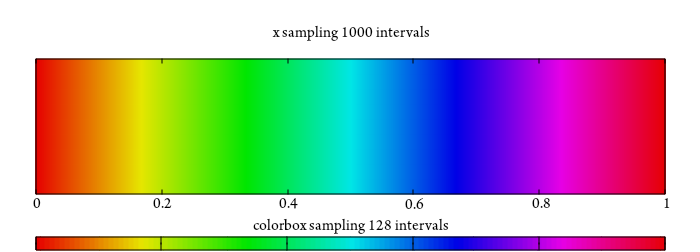
一个更通用的解决方案是为调色板定义提供自己的连续函数。例如,set palette model HSV functions gray, 1, 0.9生成下面的调色板。这与您显示的基本相同,只不过它是用连续函数定义的。
请注意,test palette的输出在底部的颜色栏中只显示了128个示例。但这并不是调色板的固有限制,它的选择只是为了方便生成测试输出。我将尝试展示这种区别(不确定它是否能在这个网站上显示出来)
set palette model HSV functions gray, 1, 0.9
set colorbox horiz user origin 0.05, 0.01 size 0.9, 0.05
set lmargin at screen 0.05; set rmargin at screen 0.95
unset ytics
set title "x sampling 1000 intervals"
set cblabel "colorbox sampling 128 intervals" norotate offset 0,1.5
set view map
set sample 1000
splot x with pm3d
您可能还必须担心您正在生成的文档所使用的颜色系统的局限性。并不是所有的输出格式都可以使用完整的24位RGB颜色规范.pdf/svg/cairo应该可以。旧的颜色索引的gif或png,另一方面,是限制在256不同的颜色总数.
https://stackoverflow.com/questions/69532730
复制相似问题
腾讯云开发者

Copyright © 2013 - 2026 Tencent Cloud. All Rights Reserved. 腾讯云 版权所有
深圳市腾讯计算机系统有限公司 ICP备案/许可证号:粤B2-20090059 ![]() 粤公网安备44030502008569号
粤公网安备44030502008569号
腾讯云计算(北京)有限责任公司 京ICP证150476号 | 京ICP备11018762号