
gganimate与geom_area的结合不能正常工作。
gganimate与geom_area的结合不能正常工作。
提问于 2021-10-24 18:18:55
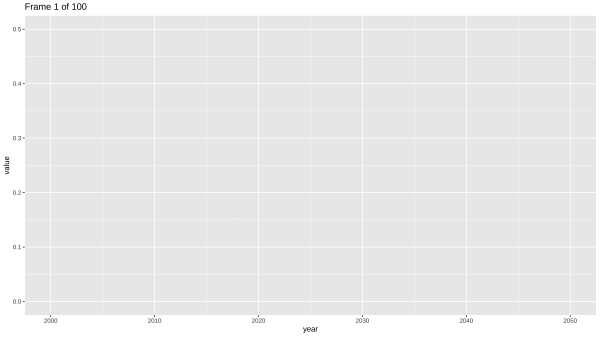
在2000年到2050年期间,我想使用具有不同值的gganimate使用geom_area来绘制一个ggplot。然而,由于某种原因,如果我包括view_zoom来保持y轴的固定,并且在大约前50帧的x轴上放大,它会在值1999.95到2000.05之间缩放,而对于最后的50帧,它会显示x轴的整个范围(从2000年到2050年)。我如何解决这个问题,使它逐渐放大,直到它显示整个范围的x轴结束?
library(gganimate)
library(tidyverse)

gif_data <-
  tibble(year = as.numeric(2000:2050),
         value = as.numeric(seq(0.5, 0.3, length.out = 51)))

gif <-
  ggplot(gif_data,
         aes(x = year,
             y = value)) +
  geom_area() +
  transition_reveal(year) +
  ggtitle('Frame {frame} of {nframes}') +
  view_zoom(fixed_y = TRUE)

animate(gif,
        fps = 10,
        duration = 10,
        height = 337.5,
        width = 600,
        units = "px",
        res = 50,
        renderer = gifski_renderer())

anim_save("~/Desktop/gif.gif",
          animation = last_animation())
回答 1
Stack Overflow用户
发布于 2022-04-17 15:51:57
使用view_follow代替view_zoom,如下所示:
gif <-
  ggplot(gif_data,
         aes(x = year,
             y = value)) +
  geom_area() +
  transition_reveal(year) +
  ggtitle('Frame {frame} of {nframes}') +
view_follow(fixed_y = TRUE)页面原文内容由Stack Overflow提供。腾讯云小微IT领域专用引擎提供翻译支持
原文链接:
https://stackoverflow.com/questions/69699583
复制相关文章
相似问题
腾讯云开发者

Copyright © 2013 - 2026 Tencent Cloud. All Rights Reserved. 腾讯云 版权所有
深圳市腾讯计算机系统有限公司 ICP备案/许可证号:粤B2-20090059 ![]() 粤公网安备44030502008569号
粤公网安备44030502008569号
腾讯云计算(北京)有限责任公司 京ICP证150476号 | 京ICP备11018762号