
带有双轴下拉菜单的交互式PCA与python
带有双轴下拉菜单的交互式PCA与python
提问于 2021-10-26 16:09:08
我正在尝试使用python (go.Scatter)中的表达式和图形对象来创建交互式PCA图。
图中应该有2个下拉菜单(对于x轴和y轴)在数据中的前5 PCA之间进行更改。
每个数据点也属于治疗组,无论是在治疗之前、之后还是QC。
我能够用巧妙的快捷包来绘制PCA1和PCA2,但是当我试图添加两个下拉菜单时,它会更新5 PCA之间的图形,结果会变得一团糟。
示例数据在我的GitHub链路中,前5列是前5个PCA。
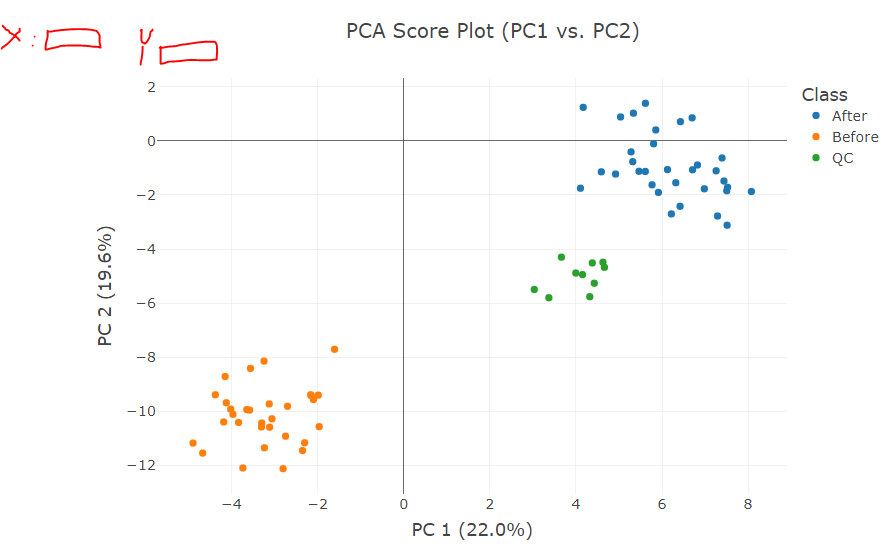
生成PC1与PC2的代码是:
labels={'0': 'PC 1 (22.0%)',
 '1': 'PC 2 (19.6%)',
 '2': 'PC 3 (11.1%)',
 '3': 'PC 4 (8.2%)',
 '4': 'PC 5 (3.9%)',
 'color': 'Group'}

fig1 = px.scatter(components_df, x=0 , y=2 ,
                  color = 'Class',
                  width=1000, height=700,
                 template='presentation',
                 labels=labels,
                 title="PCA Score Plot (PC{} vs. PC{})".format(1, 2) ,
                 hover_data=['idx', 'SampleID']
                )
fig1.show()
看起来是这样的:
我试图添加两个下拉菜单,如我在上面画,以更新x轴和y轴与不同的PC的。
因此,第一步是在图形上添加其他PC,但不知道如何巧妙地添加图形对象--表达我所做的事情:
fig = go.Figure()
for Class, group in components_df.groupby("Class"):
#     print(group[0])

    fig.add_trace(go.Scatter(x=group[0], y=group[1], name=Class, mode='markers',
      hovertemplate="Class=%s<br>PC1=%%{x}<br>PC2=%%{y}<extra></extra>"% Class))

for Class, group in components_df.groupby("Class"):
#     print(group[0])

    fig.add_trace(go.Scatter(x=group[0], y=group[2], name=Class, mode='markers',
      hovertemplate="Class=%s<br>PC1=%%{x}<br>PC3=%%{y}<extra></extra>"% Class))

fig.update_layout(
    updatemenus=[go.layout.Updatemenu(
        active=0,
        buttons=list(
            [dict(label = 'All',
                  method = 'update',
                  args = [{'visible': [True, True, True, True,True]},
                          {'title': 'All',
                           'showlegend':True}]),
             dict(label = 'PC1 PC1',
                  method = 'update',
                  args = [{'visible': [True, False, False, False, False]}, # the index of True aligns with the indices of plot traces
                          {'title': 'PC1 PC1',
                           'showlegend':True}]),
             dict(label = 'PC1 PC2',
                  method = 'update',
                  args = [{'visible': [False, True, False, False, False]},
                          {'title': 'AAPL',
                           'showlegend':True}]),
             dict(label = 'PC1 PC3',
                  method = 'update',
                  args = [{'visible': [False, False, True, False, False]},
                          {'title': 'AMZN',
                           'showlegend':True}]),
            ])
        )
    ])
结果是:
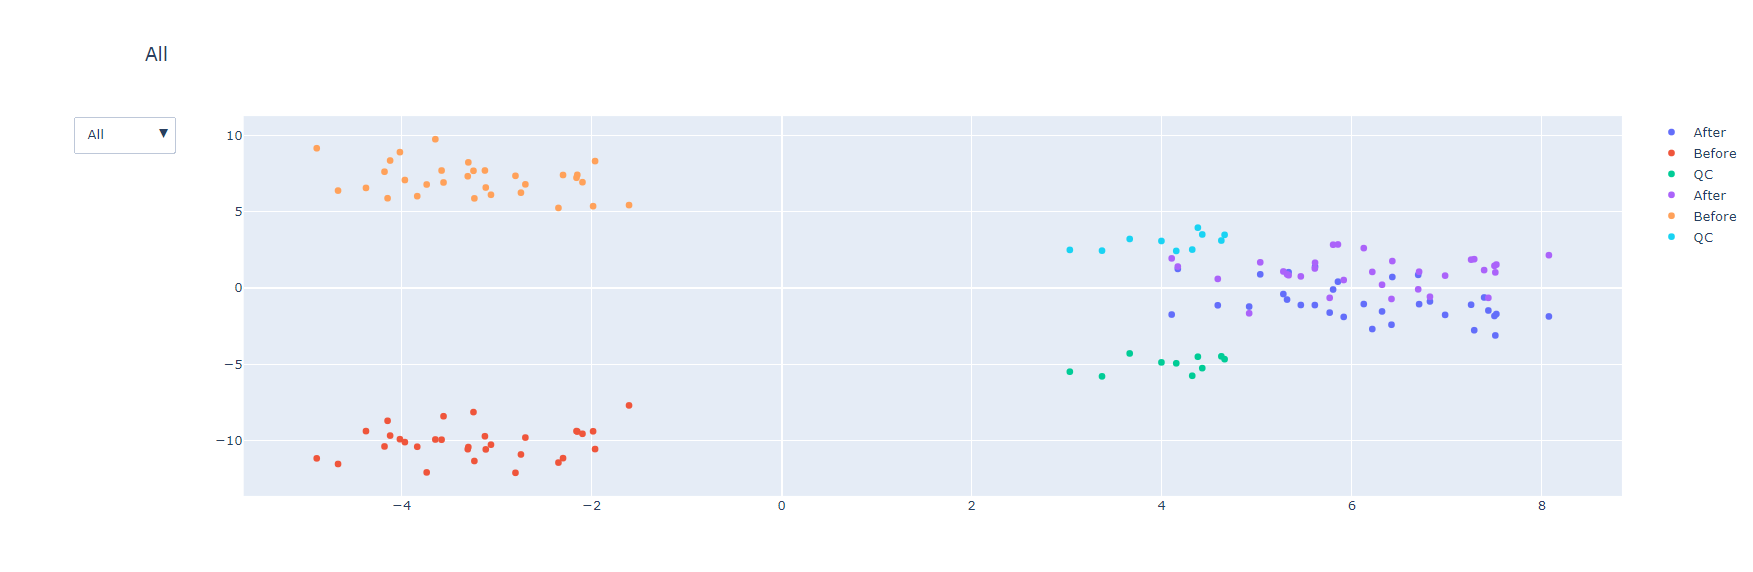
这方面有许多问题:
- 当更改下拉菜单中的不同选项时,传说也会发生变化(他们假设保留不变)。
- 当在下拉菜单中更改不同的选项时,它不会像数据那样进行循环。
- 它看起来不像在巧妙的-快车。
- 只有一个下坠
代码基于文档和博客中的许多解释:
对于如何添加正确的add_trac或正确的下拉菜单,我们将不胜感激。
谢谢!
回答 1
Stack Overflow用户
发布于 2021-10-27 06:32:25
- 这都是关于高度结构化和系统性的。Plotly 确实生成了一个不错的基本图表。使用
fig1.to_dict()查看它构建的图形对象结构 - 我发现了添加updatemenus到Plotly 图形的挑战--这是一个具有跟踪定义标记颜色的多跟踪图形。这可以简化为具有定义标记颜色的数组的单个跟踪图形。
- 那就是一个建立updatemenus.的案例这是我作为嵌套列表理解所做的。外环轴(每个菜单),内环原理组件(每个菜单项)
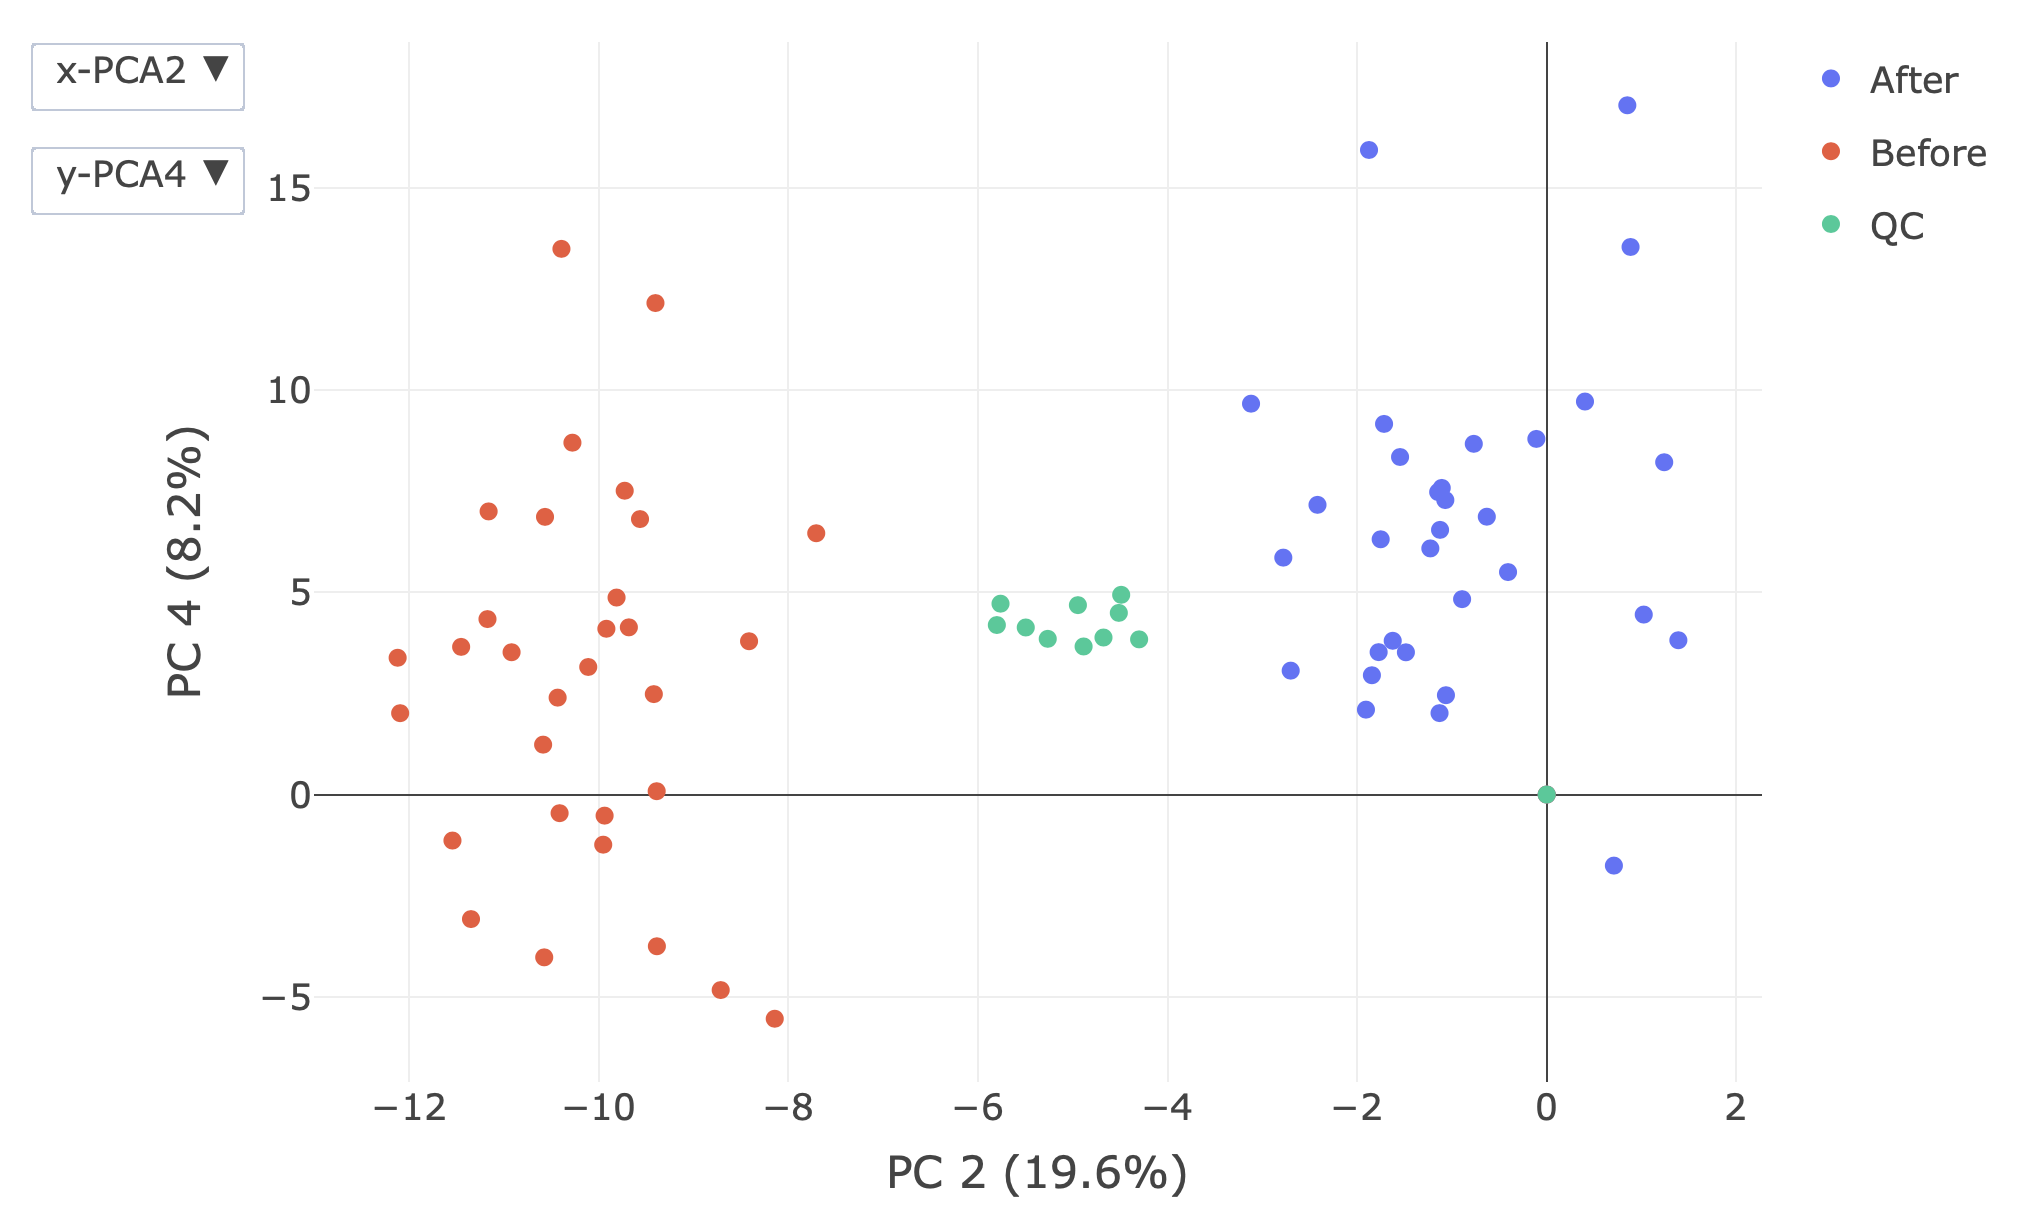
更新
- 神奇的色彩-公平的批评。我使用了一个硬编码的dict来进行颜色映射。现在,以编程方式构建
cmap,恢复到cmap的静态定义,因为dict理解是不需要的。用函数构造cmap的方法 "y": 1 if ax == "x" else 0.9我们正在构建两个下降,一个用于xaxis,一个用于yaxis。希望这些菜单的位置应该是不同的。参见docs:https://plotly.com/python/reference/layout/updatemenus/,类似的原因是设置了active属性。确保下拉列表显示了图中实际显示的内容。- 图例指的是我提出的关于多迹图形的观点。增加复杂性!必须使用合成痕迹和这种技术实际上:如何使用updatemenus更新一个特定的跟踪?
import pandas as pd
import plotly.graph_objects as go
import plotly.express as px

components_df = pd.read_csv(
    "https://raw.githubusercontent.com/TalWac/stakoverflow-Qustion/main/components_df.csv"
)

labels = {
    "0": "PC 1 (22.0%)",
    "1": "PC 2 (19.6%)",
    "2": "PC 3 (11.1%)",
    "3": "PC 4 (8.2%)",
    "4": "PC 5 (3.9%)",
    "color": "Group",
}

# cmap = {
#     cl: px.colors.qualitative.Plotly[i]
#     for i, cl in enumerate(
#         components_df.groupby("Class", as_index=False).first()["Class"]
#     )
# }
# revert back to static dictionary as dynamic building is not wanted
# cmap = {'After': '#636EFA', 'Before': '#EF553B', 'QC': '#00CC96'}
# use lambda functions instead of dict comprehension
df_c = components_df.groupby("Class", as_index=False).first()
df_c["color"] = df_c.apply(lambda r: px.colors.qualitative.Plotly[r.name], axis=1)
cmap = df_c.set_index("Class").loc[:,"color"].to_dict()

fig1 = go.Figure(
    go.Scatter(
        x=components_df["0"],
        y=components_df["1"],
        customdata=components_df.loc[:, ["idx", "SampleID", "Class"]],
        marker_color=components_df["Class"].map(cmap),
        mode="markers",
        hovertemplate="Class=%{customdata[2]}<br>x=%{x}<br>y=%{y}<br>idx=%{customdata[0]}<br>SampleID=%{customdata[1]}<extra></extra>",
    )
).update_layout(
    template="presentation",
    xaxis_title_text=labels["0"],
    yaxis_title_text=labels["1"],
    height=700,
)

fig1.update_layout(
    updatemenus=[
        {
            "active": 0 if ax == "x" else 1,
            "buttons": [
                {
                    "label": f"{ax}-PCA{pca+1}",
                    "method": "update",
                    "args": [
                        {ax: [components_df[str(pca)]]},
                        {f"{ax}axis": {"title": {"text": labels[str(pca)]}}},
                        [0],
                    ],
                }
                for pca in range(5)
            ],
            "y": 1 if ax == "x" else 0.9,
        }
        for ax in ["x", "y"]
    ]
).update_traces(showlegend=False)

# add a legend by using synthetic traces.  NB, this will leave markers at 0,0
fig1.add_traces(
    px.scatter(
        components_df.groupby("Class", as_index=False).first(),
        x="0",
        y="1",
        color="Class",
        color_discrete_map=cmap,
    )
    .update_traces(x=[0], y=[0])
    .data
)
页面原文内容由Stack Overflow提供。腾讯云小微IT领域专用引擎提供翻译支持
原文链接:
https://stackoverflow.com/questions/69726519
复制相关文章
相似问题
腾讯云开发者

Copyright © 2013 - 2026 Tencent Cloud. All Rights Reserved. 腾讯云 版权所有
深圳市腾讯计算机系统有限公司 ICP备案/许可证号:粤B2-20090059 ![]() 粤公网安备44030502008569号
粤公网安备44030502008569号
腾讯云计算(北京)有限责任公司 京ICP证150476号 | 京ICP备11018762号