
冲积图中的小地层标号-柱/轴上的不同变量
在列上有不同变量的冲积图中,我遇到了应用ggrepel()的问题。有些观察是如此之小,我需要ggrepel来使它们可读性。
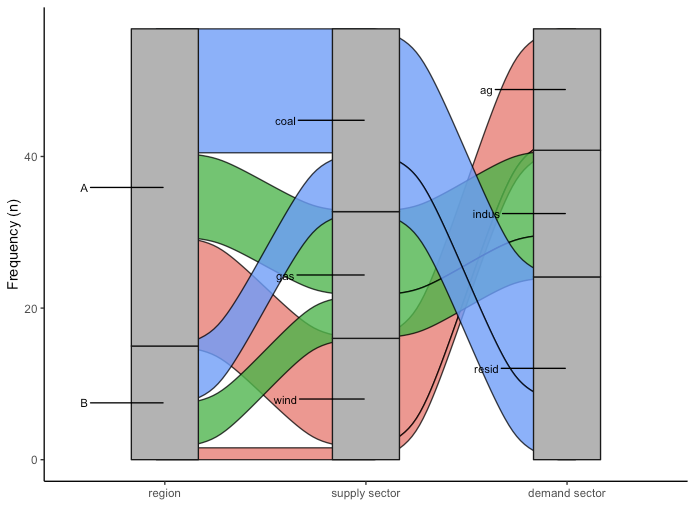
因为有三列,所以我想对每一列应用不同的ggrepel()函数:左(region):将标签对齐到中轴(supplySector)的左边:不做任何事情(即轴中的左文本)、右(demandSector):对齐轴的右侧。
我发现了这些问题:
https://cran.r-project.org/web/packages/ggalluvial/vignettes/labels.html
和
How to align and label the stratum in ggalluvial using ggrepel (or otherwise)
不同之处在于:这些示例只有2列,也有由相同变量(但变量的子集)组成的列。以前发布的修补程序是通过ifelse()进行的,在变量中选择一个子集。
ReprEx:
library(ggplot2)
library(ggrepel)
library(tidyr)
library(dplyr)

df <- data.frame(region = c("A","A","A","B","B","B"),
                 supplySector = c("coal","gas","wind","coal","gas","wind"),
                 demandSector = c("resid","indus","ag","resid","indus","ag"),
                 Freq = 20*runif(6)); df

p<- ggplot(df, aes(y = Freq, axis1 = region, axis2 = supplySector, axis3=demandSector, label = after_stat(stratum))) +
  ggalluvial::geom_alluvium(aes(fill = demandSector), width = 1/12, color="black", alpha=0.8) +
  ggalluvial::geom_stratum(width = 1/3, fill = "grey70", color = "grey10", alpha=1) +
  scale_x_discrete(limits = c("Region", "Supply Sector", "Demand Sector"), expand = c(0.3,0),drop=F) +
  scale_y_continuous("Frequency (n)")+
  theme_classic()+
theme(legend.position = "none")我尝试给colnames(df) == "region"提供一个真/假向量
p +  ggrepel::geom_text_repel(
  aes(label = ifelse(colnames(df) == "region", as.character(region), NA)),
  stat = "stratum", size = 4, direction = "y", nudge_x = -.5
)然后,我将在aes(label = ifelse(colnames(df) == "demandSector"和nudge_x = 1.5中重复这一点。
回答 1
Stack Overflow用户
发布于 2021-11-01 14:56:18
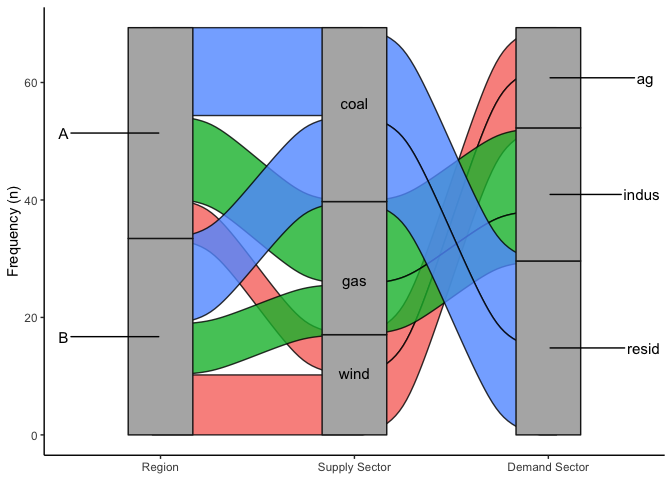
也许我搞错你了。但是,仔细看看你的例子后,我会把它称为与你在帖子中链接的答案的重复。
library(ggplot2)
library(ggrepel)
library(ggalluvial)

p +  ggrepel::geom_text_repel(
  aes(label = ifelse(after_stat(x) == 1, as.character(after_stat(stratum)), NA)),
  stat = "stratum", size = 4, direction = "y", nudge_x = -.5
) +  ggrepel::geom_text_repel(
  aes(label = ifelse(after_stat(x) == 2, as.character(after_stat(stratum)), NA)),
  stat = "stratum", size = 4, direction = "y", nudge_x = 0
) +  ggrepel::geom_text_repel(
  aes(label = ifelse(after_stat(x) == 3, as.character(after_stat(stratum)), NA)),
  stat = "stratum", size = 4, direction = "y", nudge_x = +.5
)
https://stackoverflow.com/questions/69797625
复制相似问题
腾讯云开发者

Copyright © 2013 - 2026 Tencent Cloud. All Rights Reserved. 腾讯云 版权所有
深圳市腾讯计算机系统有限公司 ICP备案/许可证号:粤B2-20090059 ![]() 粤公网安备44030502008569号
粤公网安备44030502008569号
腾讯云计算(北京)有限责任公司 京ICP证150476号 | 京ICP备11018762号