
如何自定义海运绘图的每个子图的文本滴答标签
如何自定义海运绘图的每个子图的文本滴答标签
提问于 2021-11-02 11:54:43
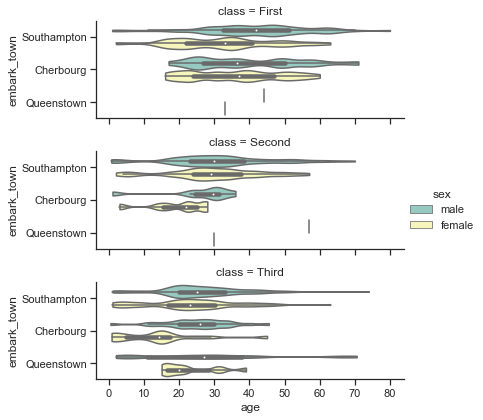
让我们考虑以下示例(来自海运文档):
titanic = sns.load_dataset("titanic")

fg = sns.catplot(x="age", y="embark_town",
                hue="sex", row="class",
                data=titanic[titanic.embark_town.notnull()],
                orient="h", height=2, aspect=3, palette="Set3",
                kind="violin", dodge=True, cut=0, bw=.2)
输出:
我想改变y轴上的勾号,例如在括号中加上一个数字:(1)南安普顿,(2)瑟堡,(3)皇后镇。我看过这个回答,我试过使用FuncFormatter,但是我得到了一个奇怪的结果。这是我的代码:
titanic = sns.load_dataset("titanic")

fg = sns.catplot(x="age", y="embark_town",
                hue="sex", row="class",
                data=titanic[titanic.embark_town.notnull()],
                orient="h", height=2, aspect=3, palette="Set3",
                kind="violin", dodge=True, cut=0, bw=.2)

from matplotlib.ticker import FuncFormatter
for ax in fg.axes.flat:
    ax.yaxis.set_major_formatter(ticker.FuncFormatter(lambda x, pos: f'({1 + pos}) {x}'))
这是输出:
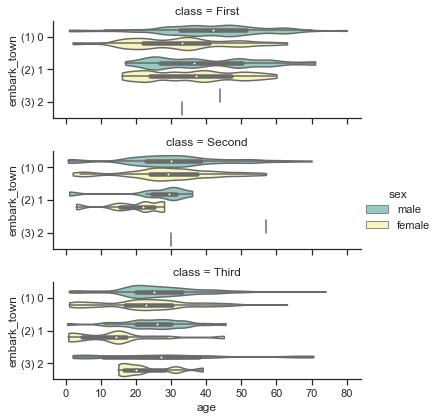
看起来x和lambda中的pos是一样的。我原以为x是滴答标签的价值(即南安普敦、瑟堡、昆斯敦)。我做错了什么?
软件版本:
matplotlib                         3.4.3
seaborn 0.11.2回答 1
Stack Overflow用户
回答已采纳
发布于 2021-11-02 13:53:26
- 类似于如何在海运挂图中旋转xticklabels的答案,但需要为每个子图的每个滴答定制文本。
- 文本标签的工作方式与另一个示例中的数字标签不同。数字标签与滴答位置匹配,但对于文本标签则不是这样。
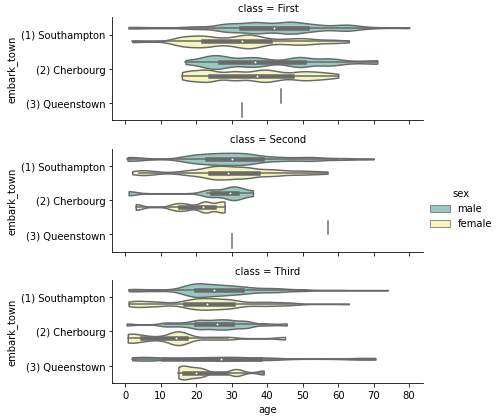
.get_yticklabels()为每个子图获取[Text(0, 0, 'Southampton'), Text(0, 1, 'Cherbourg'), Text(0, 2, 'Queenstown')]- 如下所示,提取文本和位置,并使用
.set_yticklabels设置新的文本标签 - 在
python 3.8.12**,**matplotlib 3.4.3**,**seaborn 0.11.2中测试的
import seaborn as sns

titanic = sns.load_dataset("titanic")

fg = sns.catplot(x="age", y="embark_town",
                hue="sex", row="class",
                data=titanic[titanic.embark_town.notnull()],
                orient="h", height=2, aspect=3, palette="Set3",
                kind="violin", dodge=True, cut=0, bw=.2)

for ax in fg.axes.flat:  # iterate through each subplot
    labels = ax.get_yticklabels()  # get the position and text for each subplot
    for label in labels:
        _, y = label.get_position()  # extract the y tick position
        txt = label.get_text()  # extract the text
        txt = f'({y + 1}) {txt}'  # update the text string
        label.set_text(txt)  # set the text
    ax.set_yticklabels(labels)  # update the yticklabels
页面原文内容由Stack Overflow提供。腾讯云小微IT领域专用引擎提供翻译支持
原文链接:
https://stackoverflow.com/questions/69810007
复制相关文章
相似问题
腾讯云开发者

Copyright © 2013 - 2026 Tencent Cloud. All Rights Reserved. 腾讯云 版权所有
深圳市腾讯计算机系统有限公司 ICP备案/许可证号:粤B2-20090059 ![]() 粤公网安备44030502008569号
粤公网安备44030502008569号
腾讯云计算(北京)有限责任公司 京ICP证150476号 | 京ICP备11018762号