
边缘均值和标准差的计算(OpenCV中的Canny边缘检测)
边缘均值和标准差的计算(OpenCV中的Canny边缘检测)
提问于 2021-11-14 09:42:54
我有图像,你可以看到半色调的打印,我想要计算的平均值和标准差的点。我使用OpenCV和Canny边缘检测来分离像这样的点
import cv2
img = cv2.imread('img/color_dots.png')
img_blur = cv2.GaussianBlur(img, (3,3), 0)
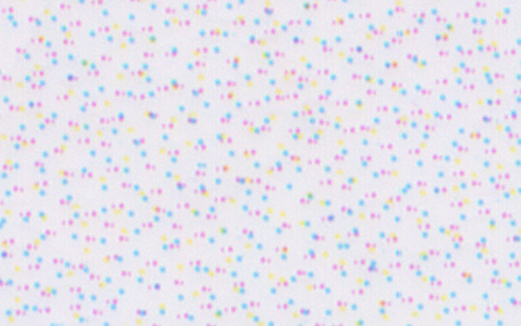
edges = cv2.Canny(image=img_blur, threshold1=50, threshold2=100)这是原图:

在这里,精明的边缘图像:
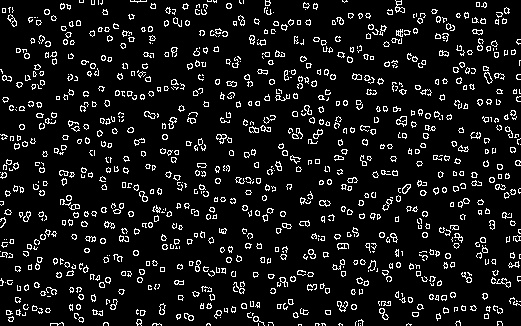
我想不是所有的点都被认出来了,尤其是黄色的.我不确定我的方法是否正确的边缘检测或更好地找到轮廓?无论如何,我如何计算这些点的平均尺寸?
回答 1
Stack Overflow用户
回答已采纳
发布于 2021-11-14 22:54:28
这里有一种在Python/OpenCV中实现这一功能的方法。
阈值背景,以隔离点。然后,您可以使用掩码直接在OpenCV中计算颜色的平均值。然后从方差的平方根中求出标准差,即图像的平方减去图像的均方。请参阅https://en.wikipedia.org/wiki/Standard_deviation
(另外,使用Numpy计算直接与np.mean和np.std的均值和标准差)
输入:
import cv2
import numpy as np

img = cv2.imread("color_dots.png")

# threshold on background color
lower = (215,215,215)
upper = (255,255,255)
thresh = cv2.inRange(img, lower, upper)

# invert so dots are white
thresh = 255 - thresh
#thresh = cv2.cvtColor(thresh, cv2.COLOR_GRAY2BGR)

# get mean colors of dots using mask
mean_values = cv2.mean(img, mask=thresh)[0:3]
mean_values = list(mean_values)
print("mean:", mean_values)

# compute square of image (as floats) and compute mean of squared image
imgf = img.astype(np.float64)
imgf2 = imgf * imgf
mean2_values = cv2.mean(imgf2, mask=thresh)[0:3]

# convert mean of image and mean of image squared tuples to arrays
mean_values_arr = np.array([mean_values])
mean2_values_arr = np.array([mean2_values])

# compute the variance from the mean of image and mean of image squared arrays
variance_values_arr = mean2_values_arr - (mean_values_arr)*(mean_values_arr)

# compute sqrt to form std
std_values_arr = np.sqrt(variance_values_arr)

# convert array to simple list
std_values = list(std_values_arr[0])
print("std:", std_values)

# save result
cv2.imwrite("color_dots_threshold.png",thresh)

cv2.imshow("thresh", thresh)
cv2.waitKey(0)
cv2.destroyAllWindows()
缩影图像:
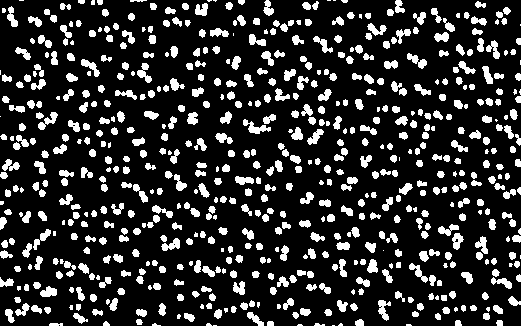
均值和标准差:
mean: [226.75895493644884, 209.73003594813198, 212.56531647194763]
std: [21.657486571574186, 19.53005158116894, 30.588081007741454]
加法
下面是使用Numpy的另一种更直接的方法。
import cv2
import numpy as np

img = cv2.imread("color_dots.png")

# threshold on background color
lower = (215,215,215)
upper = (255,255,255)
thresh = cv2.inRange(img, lower, upper)

# invert so dots are white
thresh = 255 - thresh

# separate channels
b,g,r = cv2.split(img)

# compute mean of each channel
bmean = np.mean(b[np.where(thresh==255)])
gmean = np.mean(g[np.where(thresh==255)])
rmean = np.mean(r[np.where(thresh==255)])

# compute std of each channel
bstd = np.std(b[np.where(thresh==255)])
gstd = np.std(g[np.where(thresh==255)])
rstd = np.std(r[np.where(thresh==255)])

# print results
print("mean:", bmean,gmean,rmean)
print("std:", bstd,gstd,rstd)

# save result
cv2.imwrite("color_dots_threshold.png",thresh)

cv2.imshow("thresh", thresh)
cv2.waitKey(0)
cv2.destroyAllWindows()
均值和标准差:
mean: 226.75895493644884 209.73003594813198 212.56531647194763
std: 21.657486571574225 19.53005158116893 30.58808100774145
加法2
这里可能是使用OpenCV的最简单的方法。
import cv2
import numpy as np

img = cv2.imread("color_dots.png")

# threshold on background color
lower = (215,215,215)
upper = (255,255,255)
thresh = cv2.inRange(img, lower, upper)

# invert so dots are white
thresh = 255 - thresh

# compute mean and standard deviation
mean, std = cv2.meanStd(img, mask=thresh)[0:3]

# print results
print("mean:", mean)
print("std:", std)

# save result
cv2.imwrite("color_dots_threshold.png",thresh)

cv2.imshow("thresh", thresh)
cv2.waitKey(0)
cv2.destroyAllWindows()
均值和标准差:
mean: 226.75895493644884 209.73003594813198 212.56531647194763
std: 21.657486571574225 19.53005158116893 30.58808100774145页面原文内容由Stack Overflow提供。腾讯云小微IT领域专用引擎提供翻译支持
原文链接:
https://stackoverflow.com/questions/69961871
复制相关文章
相似问题
腾讯云开发者

Copyright © 2013 - 2026 Tencent Cloud. All Rights Reserved. 腾讯云 版权所有
深圳市腾讯计算机系统有限公司 ICP备案/许可证号:粤B2-20090059 ![]() 粤公网安备44030502008569号
粤公网安备44030502008569号
腾讯云计算(北京)有限责任公司 京ICP证150476号 | 京ICP备11018762号