
如何提高热带雨林中标牌距主小区的距离
如何提高热带雨林中标牌距主小区的距离
提问于 2021-11-21 18:41:08
回答 1
Stack Overflow用户
发布于 2021-11-21 19:04:08
您可以使用heatmaply使用margins更改页边距。
由于您的问题中没有提供任何代码,我将使用mtcars并更改y轴边距的示例绘图。
heatmaply(mtcars, margins = c(0, 200, 0, 0))
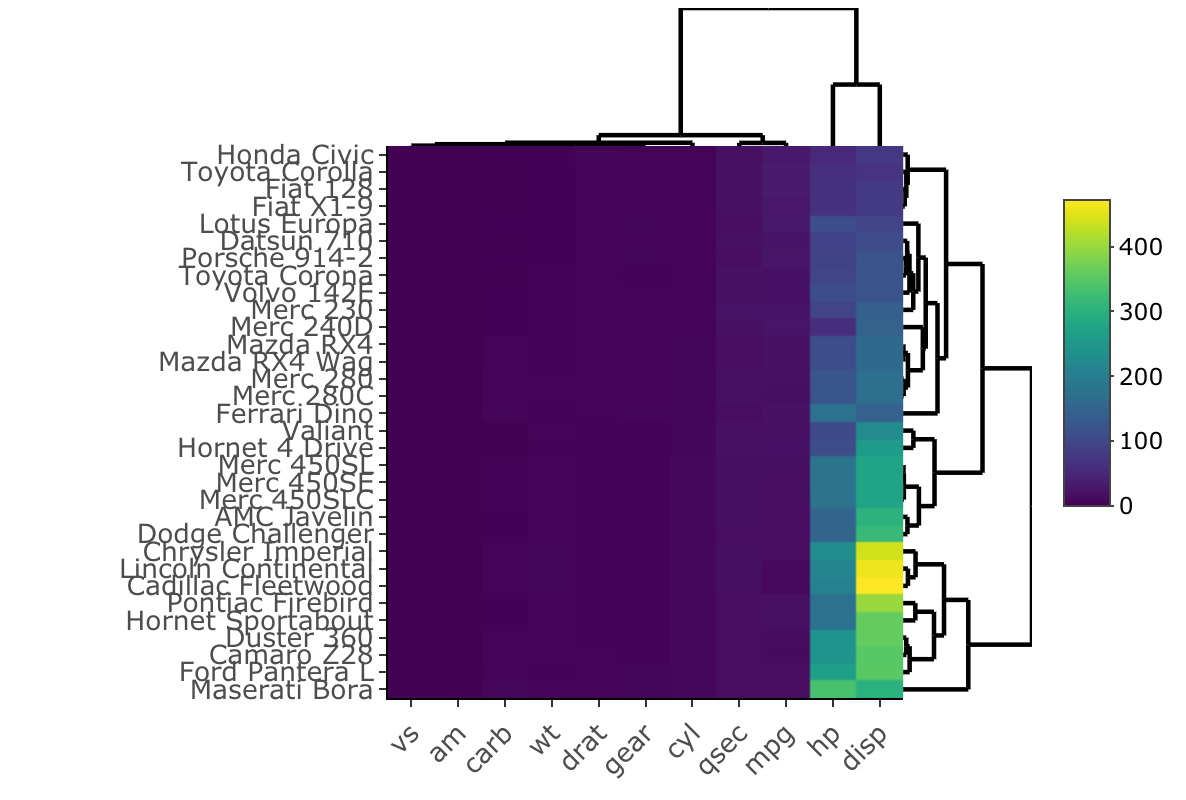
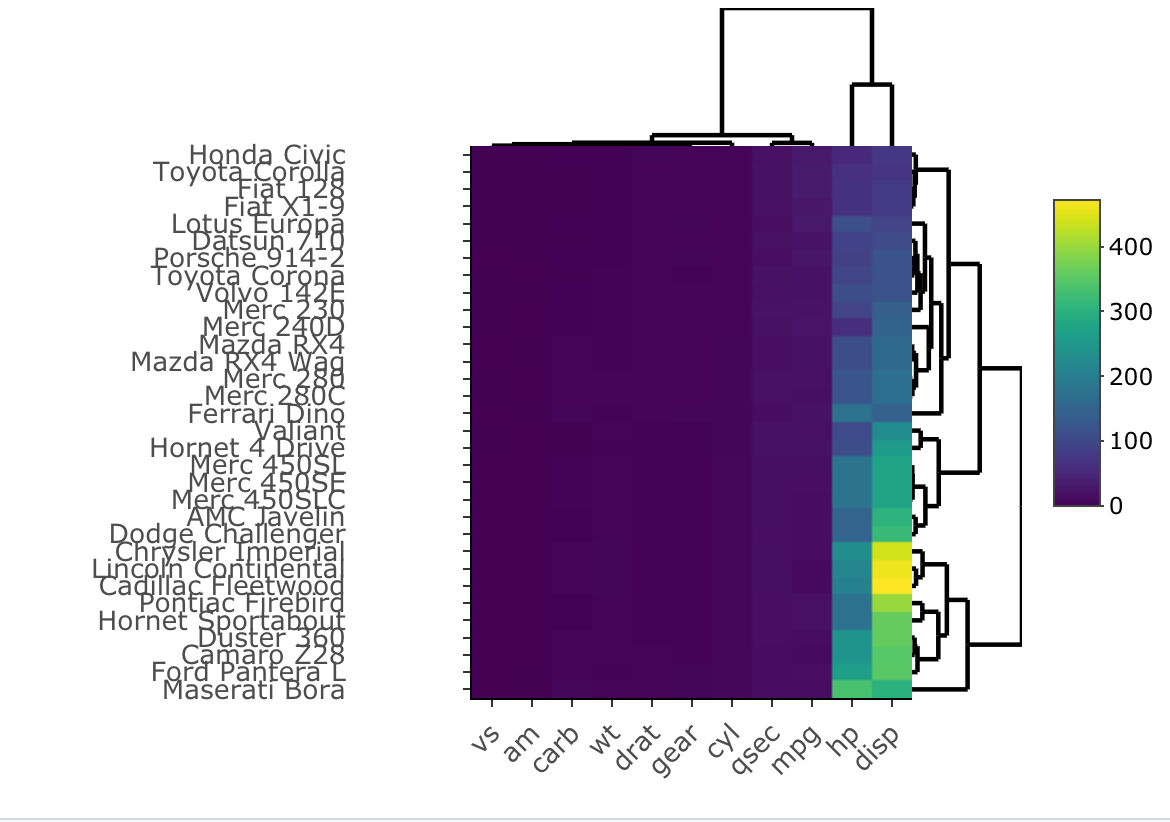
如果你想把y轴标签从图中移开,那就更棘手了。目前,似乎没有办法做到这一点,然而,这里有一个解决办法。现在有一种在heatmaply中移动y轴标签的方法。总的来说,这是一个糟糕的解决办法,但它似乎是目前最好的解决方案。
df <- mtcars
#extract the labels on the y axis. In this example mtcars y-axis labels are the row names
df2 <- as.data.frame(rownames(mtcars))
#you then have to add spaces to the end of the labels and then apply this to the dataframe you are using.
rownames(df) <- paste0(df2$`rownames(mtcars)`, "            ")
#you can now run heatmaply on the new labels with added spaces
heatmaply(df)
总的来说,plotly有一些很好的特性,但是它缺乏可调性。heatmaply的功能甚至比plotly更少,因此它使您更难以您想要的方式调优您的图形。
页面原文内容由Stack Overflow提供。腾讯云小微IT领域专用引擎提供翻译支持
原文链接:
https://stackoverflow.com/questions/70057539
复制相关文章
相似问题
腾讯云开发者

Copyright © 2013 - 2026 Tencent Cloud. All Rights Reserved. 腾讯云 版权所有
深圳市腾讯计算机系统有限公司 ICP备案/许可证号:粤B2-20090059  粤公网安备44030502008569号
腾讯云计算(北京)有限责任公司 京ICP证150476号 | 京ICP备11018762号