
分析器(nvvp和nvprof)没有显示“页面故障”信息
分析器(nvvp和nvprof)没有显示“页面故障”信息
提问于 2021-11-29 12:12:01
我正在分析在NVIDIA的开发者论坛上展示在CUDA初学者的统一内存上的测试代码。
代码:
#include <iostream>
#include <math.h>

// CUDA kernel to add elements of two arrays
__global__
void add(int n, float* x, float* y)
{
    int index = blockIdx.x * blockDim.x + threadIdx.x;
    int stride = blockDim.x * gridDim.x;
    for (int i = index; i < n; i += stride)
        y[i] = x[i] + y[i];
}

int main(void)
{
    int N = 1 << 20;
    float* x, * y;

    // Allocate Unified Memory -- accessible from CPU or GPU
    cudaMallocManaged(&x, N * sizeof(float));
    cudaMallocManaged(&y, N * sizeof(float));

    // initialize x and y arrays on the host
    for (int i = 0; i < N; i++) {
        x[i] = 1.0f;
        y[i] = 2.0f;
    }

    // Launch kernel on 1M elements on the GPU
    int blockSize = 256;
    int numBlocks = (N + blockSize - 1) / blockSize;
    add << <numBlocks, blockSize >> > (N, x, y);

    // Wait for GPU to finish before accessing on host
    cudaDeviceSynchronize();

    // Check for errors (all values should be 3.0f)
    float maxError = 0.0f;
    for (int i = 0; i < N; i++)
        maxError = fmax(maxError, fabs(y[i] - 3.0f));
    std::cout << "Max error: " << maxError << std::endl;

    // Free memory
    cudaFree(x);
    cudaFree(y);

    return 0;
}问题:作者提供的分析结果显示了关于“页面错误”的信息,但是当我运行nvprof和nvvp分析器时,我没有得到任何关于页面错误的信息。是否有任何需要显式设置的标志或东西来获取该信息?
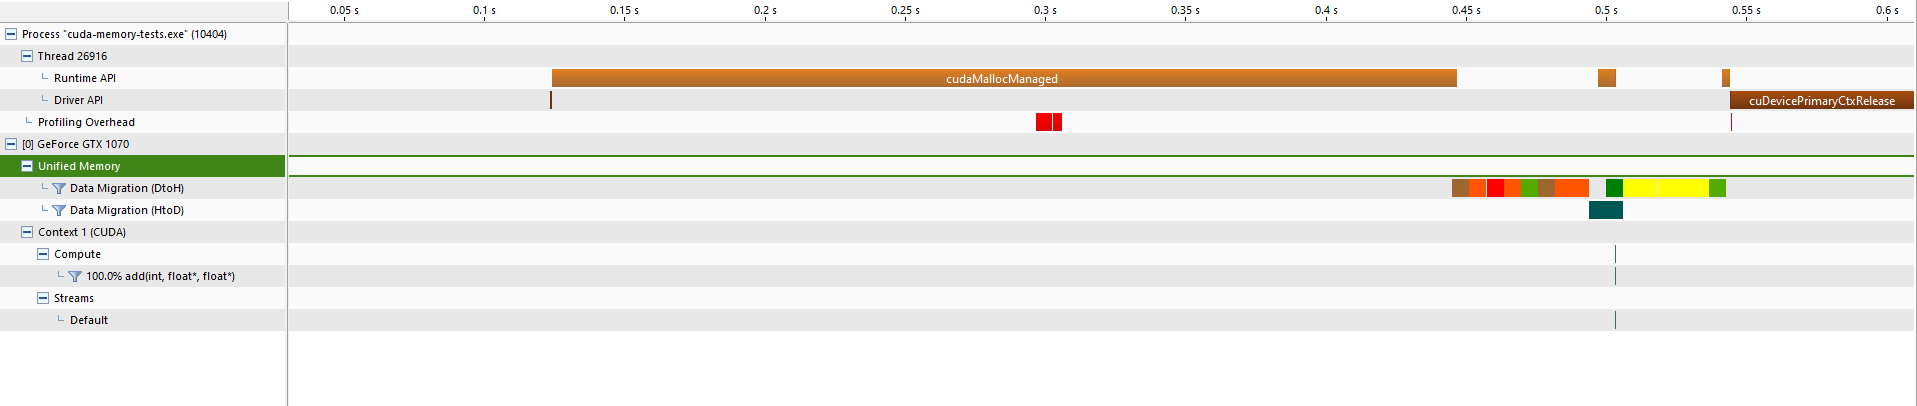
我的输出:
== 20160 == Profiling result :
Type  Time(%)      Time     Calls       Avg       Min       Max  Name
GPU activities : 100.00 % 60.513us         1  60.513us  60.513us  60.513us  add(int, float*, float*)
API calls : 81.81 % 348.14ms         2  174.07ms  1.5933ms  346.54ms  cudaMallocManaged
16.10 % 68.511ms         1  68.511ms  68.511ms  68.511ms  cuDevicePrimaryCtxRelease
1.34 % 5.7002ms         1  5.7002ms  5.7002ms  5.7002ms  cudaLaunchKernel
0.66 % 2.8192ms         2  1.4096ms  1.0669ms  1.7523ms  cudaFree
0.07 % 277.80us         1  277.80us  277.80us  277.80us  cudaDeviceSynchronize
0.01 % 33.500us         3  11.166us  3.5000us  16.400us  cuModuleUnload
0.00 % 19.800us         1  19.800us  19.800us  19.800us  cuDeviceTotalMem
0.00 % 16.700us       101     165ns     100ns     900ns  cuDeviceGetAttribute
0.00 % 9.2000us         3  3.0660us     200ns  8.2000us  cuDeviceGetCount
0.00 % 3.1000us         1  3.1000us  3.1000us  3.1000us  cuDeviceGetName
0.00 % 2.1000us         2  1.0500us     300ns  1.8000us  cuDeviceGet
0.00 % 300ns         1     300ns     300ns     300ns  cuDeviceGetLuid
0.00 % 200ns         1     200ns     200ns     200ns  cuDeviceGetUuid

== 20160 == Unified Memory profiling result :
Device "GeForce GTX 1070 (0)"
Count  Avg Size  Min Size  Max Size  Total Size  Total Time  Name
64  128.00KB  128.00KB  128.00KB  8.000000MB  3.217900ms  Host To Device
146  84.164KB  32.000KB  1.0000MB  12.00000MB  68.17800ms  Device To Host
我的nvvp分析结果:
回答 1
Stack Overflow用户
回答已采纳
发布于 2021-11-29 14:06:39
操作系统很重要。
您在windows上,当pascal或更新的设备出现时,CUDA统一内存(UM)系统与linux相比可以使用在窗户上有很大不同。
在windows上,页错误不是UM系统用来确定何时迁移数据的机制,因此它们不会在分析器中或由分析器报告。
页面原文内容由Stack Overflow提供。腾讯云小微IT领域专用引擎提供翻译支持
原文链接:
https://stackoverflow.com/questions/70154443
复制相关文章
相似问题
腾讯云开发者

Copyright © 2013 - 2026 Tencent Cloud. All Rights Reserved. 腾讯云 版权所有
深圳市腾讯计算机系统有限公司 ICP备案/许可证号:粤B2-20090059 ![]() 粤公网安备44030502008569号
粤公网安备44030502008569号
腾讯云计算(北京)有限责任公司 京ICP证150476号 | 京ICP备11018762号