
只稍微改变geom段的x位置,但保持xend的位置不变
只稍微改变geom段的x位置,但保持xend的位置不变
提问于 2021-12-03 05:54:08
我想用三列绘制一个条形图,其中两个箭头从一列开始到另两列,这些箭头不重叠,如下所示。
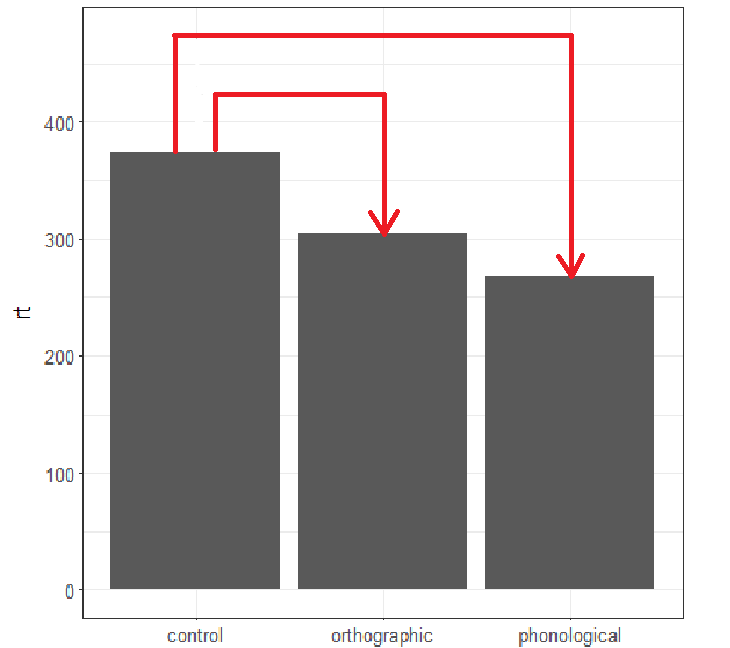
我成功地生成了图表,并使用geom_segments绘制箭头。但是,当箭头从列control开始时会重叠。
我以为我可以通过设置geom_segment(..., position = position_nudge(x = 0.25))来处理这个问题。然而,这不仅改变了x的地位,也改变了xend的地位。那么,我应该如何稍微改变geom_segment的x的位置,保持xend的位置不变?

米维
library(tidyverse)

demoData <- tribble(
  ~priming, ~rt,
  "control", 374,
  "phonological", 267,
  "orthographic", 304
) |>
mutate(
  diff.from.baseline = rt - first(rt)
)

baseline <- demoData |>
  filter(priming == "control") |>
  dplyr::select(rt) |>
  pull()

demoData |>
  ggplot(
    aes(
      x = priming,
      y = rt
    )
  ) +
  geom_col() +
  #### from control to orthographic
  geom_segment(
    aes(
      x = "control",
      y = baseline,
      xend = "control",
      yend = baseline + 50
    )#,
    #position = position_dodge2(
    #  width = 0.5,
    #  preserve = "total"
    #  )
    #position = position_nudge(
    #  x = 0.25,
    #  xend = 0
    #)
  ) +
  geom_segment(
    aes(
      x = "control"  + 0.25,
      y = baseline + 50,
      xend = "orthographic",
      yend = baseline + 50
    )#,
    #position = position_dodge2(
    #  width = 1,
    #  preserve = "total"
    #  )
    #position = position_nudge(
    #  x = 0.25,
    #  xend = 0
    #)
  ) +
  geom_segment(
    aes(
      x = "orthographic",
      y = baseline + 50,
      xend = "orthographic",
      yend = demoData |>
        filter(priming == "orthographic") |>
        dplyr::select(rt) |>
        pull()
    ),
    arrow = arrow()
  ) +
  #### from control to phonological
  geom_segment(
    aes(
      x = "control",
      y = baseline,
      xend = "control",
      yend = baseline + 100
    )
  ) +
  geom_segment(
    aes(
      x = "control",
      y = baseline + 100,
      xend = "phonological",
      yend = baseline + 100
    )
  ) +
  geom_segment(
    aes(
      x = "phonological",
      y = baseline + 100,
      xend = "phonological",
      yend = demoData |>
        filter(priming == "phonological") |>
        dplyr::select(rt) |>
        pull()
    ),
    arrow = arrow()
)回答 1
Stack Overflow用户
回答已采纳
发布于 2021-12-03 06:36:27
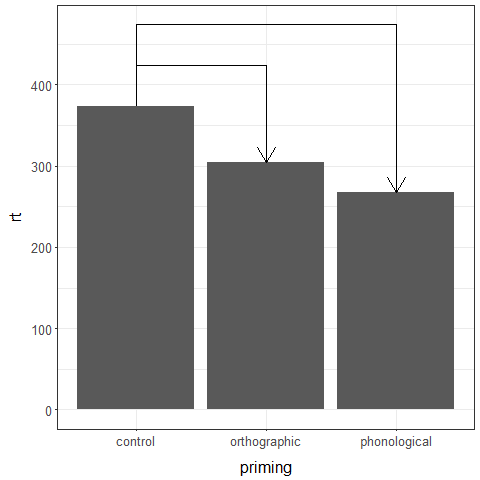
下面是一个方法:
segments <- data.frame(seg = rep(c(1:2), each = 4),
                       x = c(0.8, 0.8, 3, 3, 1.2, 1.2, 2, 2),
                       y = c(as.numeric(demoData[1,2]), 450,
                                        450, as.numeric(demoData[3,2]),
                            as.numeric(demoData[1,2]), 425,
                                       425, as.numeric(demoData[2,2])))

ggplot() +
  geom_path(data = segments, aes(x, y, group = seg), arrow = arrow()) +
  geom_col(data = demoData,
           aes(x = as.numeric(factor(demoData$priming,
                                     levels = demoData$priming)), rt)) +
  scale_x_continuous(breaks = 1:3, labels = demoData$priming)
页面原文内容由Stack Overflow提供。腾讯云小微IT领域专用引擎提供翻译支持
原文链接:
https://stackoverflow.com/questions/70210095
复制相关文章
相似问题
腾讯云开发者

Copyright © 2013 - 2026 Tencent Cloud. All Rights Reserved. 腾讯云 版权所有
深圳市腾讯计算机系统有限公司 ICP备案/许可证号:粤B2-20090059 ![]() 粤公网安备44030502008569号
粤公网安备44030502008569号
腾讯云计算(北京)有限责任公司 京ICP证150476号 | 京ICP备11018762号