
如何在Python中绘制“随时间变化的距离和速度”的数学函数?
我在努力做一些Python作业。
我对Python和一般的编码都很陌生。我掌握Python方面的基本知识,在JavaScript中有一些可接受的水平。
我的问题是:我必须绘制一个图表来表示这两个函数:
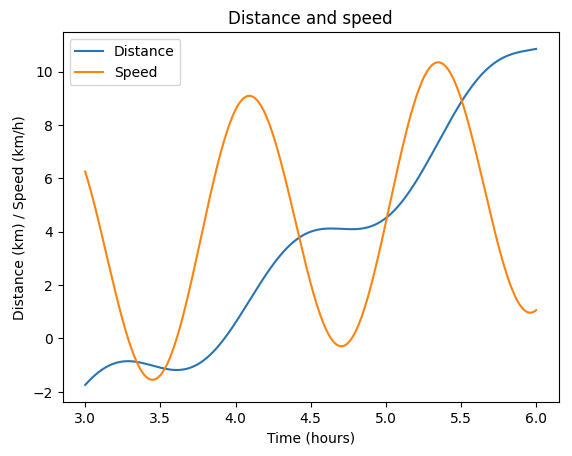
distance = (x**2/2 - np.cos(5*x) - 7)

speed = (x + 5*np.sin(5*x))
时间戳3至6之间(含)
我知道我必须用Pandas来制作一个DataFrame,我知道我必须用MatPlotLib来制作实际的情节,我必须用Numpy来计算,但是我不能让数学被识别为数学函数,因为我根本不知道怎么做。
这就是图形应该是什么样子:随时间变化的距离和速度图
这就是我的代码现在要查找的内容:
import pandas as pd
import matplotlib.pyplot as plt
import numpy as np

x = 10

time = [3, 6]

distance = (x**2/2 - np.cos(5*x) - 7)

speed = (x + 5*np.sin(5*x))

values = {'Distance': distance, 'Speed': speed, 'Time': time}

df = pd.DataFrame(data= values)

df.plot(title='Distance and speed', xlabel='Time (hours)', ylabel='Distance (km) / Speed (km/h)', x='Time')

plt.show()
X= 10我知道不应该包括在内,但是由于我遗漏了使数学工作的部分,所以我必须把它包括进来,使它“工作”,而不会出现错误。
我有一个模糊的想法,使用Numpy是我的问题的答案,但我不知道如何(目前,希望)。
我有多错?有谁可以帮我?
回答 2
Stack Overflow用户
发布于 2022-12-03 23:06:53
看起来你的代码就快到了!您已经导入了所有必要的库,并且正确地定义了您的距离和速度函数。
要使代码正常工作,需要指定要用于图形的x轴的值范围。在这种情况下,您希望使用3到6之间的值(包括在内)。为此,您可以在Python中使用range函数,它将在给定的范围内生成一个数字序列。
下面是一个示例,说明如何使用range函数来指定要使用的x值范围:
x_values = np.arange(0.0, 20.0, 0.01) 一旦生成了x-值列表,就可以使用for循环迭代每个值,并计算相应的距离和速度值。然后,您可以将这些值存储在单独的列表中,您可以使用这些列表创建DataFrame。
下面是一个示例,说明如何使用for循环计算每个x值的距离和速度值:
# Initialize empty lists to store the distance and speed values
distance_values = []
speed_values = []

# Iterate over each x-value
for x in x_values:
  # Calculate the distance and speed values for the current x-value
  distance = (x**2/2 - np.cos(5*x) - 7)
  speed = (x + 5*np.sin(5*x))

  # Append the calculated values to their respective lists
  distance_values.append(distance)
  speed_values.append(speed)
一旦计算了每个x值的距离和速度值,就可以使用这些列表来创建DataFrame。然后,您可以使用DataFrame的绘图方法来创建图形。
下面是如何创建DataFrame并绘制图形的示例:
# Create the DataFrame using the x-values, distance values, and speed values
df = pd.DataFrame({'Time': x_values, 'Distance': distance_values, 'Speed': speed_values})

# Use the plot method of the DataFrame to create the graph
df.plot(title='Distance and speed', xlabel='Time (hours)', ylabel='Distance (km) / Speed (km/h)', x='Time')

# Show the graph
plt.show()Stack Overflow用户
发布于 2022-12-04 04:19:31
对张贴版本的更正
- 使用变量t表示时间(而不是x)
- np.arange(3,6.01,0.01)从3到6的时间
码
# time values from 3 to 6 inclusive in steps of 0.01 (use 6.01 to include 6)
t = np.arange(3, 6.01, 0.01)  # t for time

# Use NumPy array operations to compute distance and speed at all time values (i.e. x axis)
distance = (t**2/2 - np.cos(5*t) - 7)
speed = (t + 5*np.sin(5*t))
values = {'Distance': distance, 'Speed': speed, 'Time': t}  # x is time t

df = pd.DataFrame(data= values)
df.plot(title='Distance and speed', xlabel='Time (hours)', ylabel='Distance (km) / Speed (km/h)', x='Time')

plt.show()
https://stackoverflow.com/questions/74671475
复制相似问题
腾讯云开发者

Copyright © 2013 - 2026 Tencent Cloud. All Rights Reserved. 腾讯云 版权所有
深圳市腾讯计算机系统有限公司 ICP备案/许可证号:粤B2-20090059 ![]() 粤公网安备44030502008569号
粤公网安备44030502008569号
腾讯云计算(北京)有限责任公司 京ICP证150476号 | 京ICP备11018762号