
如何获得每个变量的多个图
如何获得每个变量的多个图
提问于 2022-12-02 15:28:50
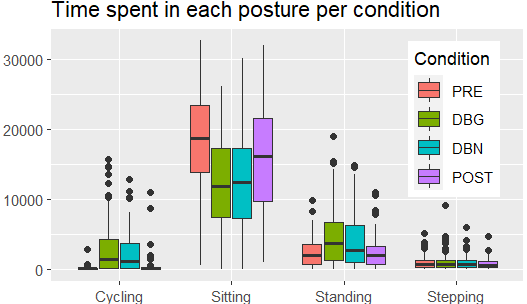
我不知道每个变量如何制作多个情节。所以我想要这样的东西:
我的数据是这样的
> head(Captiv_mean)
  Participant.Code Condition     Class.1 Upper_Left_Arm_RULA Upper_Right_Arm_RULA Neck_RULA Trunk_RULA
1           AE1_01       DBG Calibration            1.187500            1.2155172 3.3225575  0.4798851
2           AE1_01       DBG     Sitting            2.962401            3.0016527 5.1971110  2.8696135
3           AE1_01       DBG    Stepping            2.494737            1.9894737 4.6052632  1.4052632
4           AE1_01       PRE Calibration            1.678552            1.2618384 5.5771588  0.6072423
5           AE1_01       PRE       Other            0.132678            0.1103238 0.6377426  0.2530313
6           AE1_01       PRE     Sitting            2.013686            1.6693523 5.8169352  1.7554690
我希望每个"Class.1“有一个图(总共有4个不同的图,这样每个"Class.1”中的所有数据都在它们的on图中分组(您可以忽略第一列)。需要注意的是,我需要每个图中的数据按列“条件”分组。如果你需要更多的信息,请告诉我。
回答 1
Stack Overflow用户
回答已采纳
发布于 2022-12-02 15:52:46
特别是在ggplot2中,“融化”(将数据从“宽”修改为“长”)通常是好的。我将为此使用tidyr::pivot_longer,尽管使用reshape2::melt (和data.table::melt)很容易。
library(tidyr)
library(ggplot2)
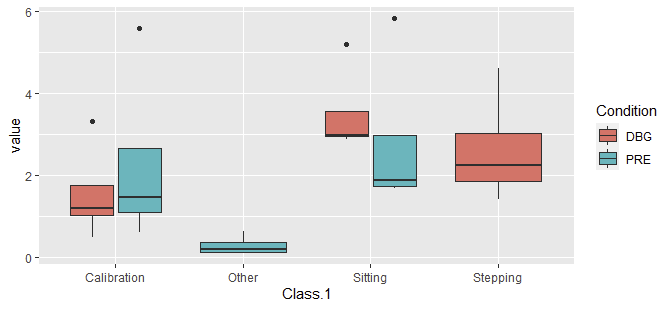
pivot_longer(Captiv_mean, -c("Participant.Code", "Condition", "Class.1")) |>
ggplot(aes(Class.1, value, fill = Condition)) +
geom_boxplot(position = position_dodge(preserve = "single"))
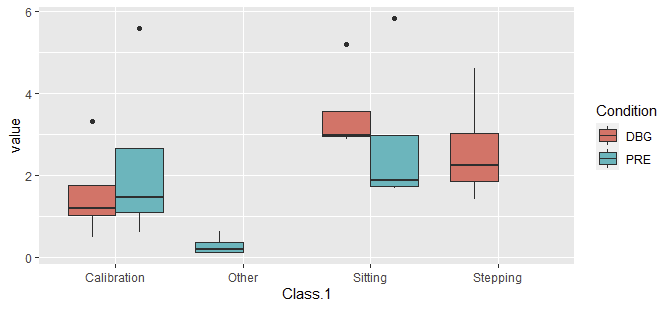
之所以需要position_dodge(..),是因为示例数据不包括Class.1和Condition的所有组合的值,从而导致某些组具有不同的宽度。没有position=..,我们看到:
数据
Captiv_mean <- structure(list(Participant.Code = c("AE1_01", "AE1_01", "AE1_01", "AE1_01", "AE1_01", "AE1_01"), Condition = c("DBG", "DBG", "DBG", "PRE", "PRE", "PRE"), Class.1 = c("Calibration", "Sitting", "Stepping", "Calibration", "Other", "Sitting"), Upper_Left_Arm_RULA = c(1.1875, 2.962401, 2.494737, 1.678552, 0.132678, 2.013686), Upper_Right_Arm_RULA = c(1.2155172, 3.0016527, 1.9894737, 1.2618384, 0.1103238, 1.6693523), Neck_RULA = c(3.3225575, 5.197111, 4.6052632, 5.5771588, 0.6377426, 5.8169352), Trunk_RULA = c(0.4798851, 2.8696135, 1.4052632, 0.6072423, 0.2530313, 1.755469)), class = "data.frame", row.names = c("1", "2", "3", "4", "5", "6"))页面原文内容由Stack Overflow提供。腾讯云小微IT领域专用引擎提供翻译支持
原文链接:
https://stackoverflow.com/questions/74658064
复制相关文章
相似问题
腾讯云开发者

Copyright © 2013 - 2026 Tencent Cloud. All Rights Reserved. 腾讯云 版权所有
深圳市腾讯计算机系统有限公司 ICP备案/许可证号:粤B2-20090059 ![]() 粤公网安备44030502008569号
粤公网安备44030502008569号
腾讯云计算(北京)有限责任公司 京ICP证150476号 | 京ICP备11018762号