
如何用R量化图的下载斜率
如何用R量化图的下载斜率
提问于 2022-11-25 07:22:58
我有以下数据框架:
df <- structure(list(
  peptide = structure(c(
    1L, 1L, 1L, 1L, 2L, 2L,
    2L, 2L, 3L, 3L, 3L, 3L, 4L, 4L, 4L, 4L, 5L, 5L, 5L, 5L
  ), levels = c(
    "P1",
    "P2", "P3", "P4", "P5"
  ), class = "factor"), reaction_time = c(
    0,
    3, 5, 10, 0, 3, 5, 10, 0, 3, 5, 10, 0, 3, 5, 10, 0, 3, 5, 10
  ),
  mean_residual_quantity = c(
    100, 110, 114, 110.5, 100, 91,
    84.5, 69.5, 100, 75, 70, 59, 100, 63.5, 58, 43, 100, 44,
    28, 12
  )
), class = c("grouped_df", "tbl_df", "tbl", "data.frame"), row.names = c(NA, -20L), groups = structure(list(peptide = structure(1:5, levels = c(
  "P1",
  "P2", "P3", "P4", "P5"
), class = "factor"), .rows = structure(list(
  1:4, 5:8, 9:12, 13:16, 17:20
), ptype = integer(0), class = c(
  "vctrs_list_of",
  "vctrs_vctr", "list"
))), class = c("tbl_df", "tbl", "data.frame"), row.names = c(NA, -5L), .drop = TRUE))
使用此代码:
ggpubr::ggline(df,
       x = "reaction_time",
       y = "mean_residual_quantity",
       color = "peptide",
       xlab = "Reaction Time",
       palette = "jco",
       size = 1,
       ylab = "Residual Quantity (%)"
) +
  scale_y_continuous(breaks = get_breaks(n = 10)) +
  grids() +
  rremove("legend.title")
我可以创造出这样的情节:
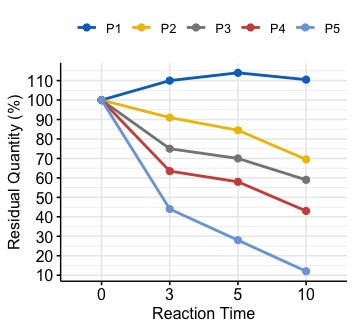
从视觉上看,我们可以看到,从P1到P5,图形的斜率一直在下降。对于每一个P1到P5,是否有一个单一的度量来量化这种下降趋势?
最后,如果我们对这个值进行排序,那么顺序应该是P1,P2,P3,P4,P5。
我如何用R来实现它呢?
回答 2
Stack Overflow用户
发布于 2022-11-25 07:49:28
假设斜率是第一个值和最后一个值之间的斜率。
如果每个mean_residual_quantity的第一个peptide值与数据相同,
library(dplyr)
df %>%
  arrange(reaction_time) %>%
  group_by(peptide) %>%
  filter(row_number() == n()) %>%
  arrange(desc(mean_residual_quantity)) %>% pull(peptide)
如果不是,
library(dplyr)
library(data.table)
df %>%
  arrange(reaction_time) %>%
  group_by(peptide) %>%
  filter(row_number() == 1 | row_number() == n()) %>%
  summarize(slope = (last(mean_residual_quantity) - first(mean_residual_quantity))/
              (last(reaction_time) - first(reaction_time))) %>%
  arrange(desc(slope)) %>% pull(peptide)
会给出你想要的结果
[1] P1 P2 P3 P4 P5
Levels: P1 P2 P3 P4 P5
这里还有另一个选项,就是在每两个连续的点之间按斜率排序。
df %>%
  arrange(peptide, mean_residual_quantity) %>%
  group_by(peptide) %>%
  mutate(slope = (mean_residual_quantity - lag(mean_residual_quantity))/
           (reaction_time - lag(reaction_time))) %>%
  summarize(slope_mean = mean(slope, na.rm = T)) %>%
arrange(desc(slope_mean)) %>% pull(peptide)Stack Overflow用户
发布于 2022-11-25 08:17:52
另一种可能的、完全任意的方法是,对每个时间点对每个P进行排序,然后对每个P的秩进行求和,得到一种总秩。从图表中转录你的数据
df=data.frame(
  "RT"=c(0,3,5,10),
  "P1"=c(100,110,115,110),
  "P2"=c(100,90,85,70),
  "P3"=c(100,75,70,60),
  "P4"=c(100,65,60,40),
  "P5"=c(100,45,30,10)
)
tmp=t(apply(df[,-1],1,rank))
colSums(tmp)

P1 P2 P3 P4 P5
18 15 12 9 6页面原文内容由Stack Overflow提供。腾讯云小微IT领域专用引擎提供翻译支持
原文链接:
https://stackoverflow.com/questions/74569424
复制相关文章
相似问题
腾讯云开发者

Copyright © 2013 - 2026 Tencent Cloud. All Rights Reserved. 腾讯云 版权所有
深圳市腾讯计算机系统有限公司 ICP备案/许可证号:粤B2-20090059 ![]() 粤公网安备44030502008569号
粤公网安备44030502008569号
腾讯云计算(北京)有限责任公司 京ICP证150476号 | 京ICP备11018762号