
如何获得火花流指标,如输入行、处理行和批处理持续时间到Prometheus
如何获得火花流指标,如输入行、处理行和批处理持续时间到Prometheus
提问于 2022-11-24 14:17:09
我一直在阅读这篇文章-- https://www.databricks.com/session_na20/native-support-of-prometheus-monitoring-in-apache-spark-3-0,有人提到,我们可以将诸如输入行、处理速率和批处理持续时间这样的火花流指标输入到prometheus中。
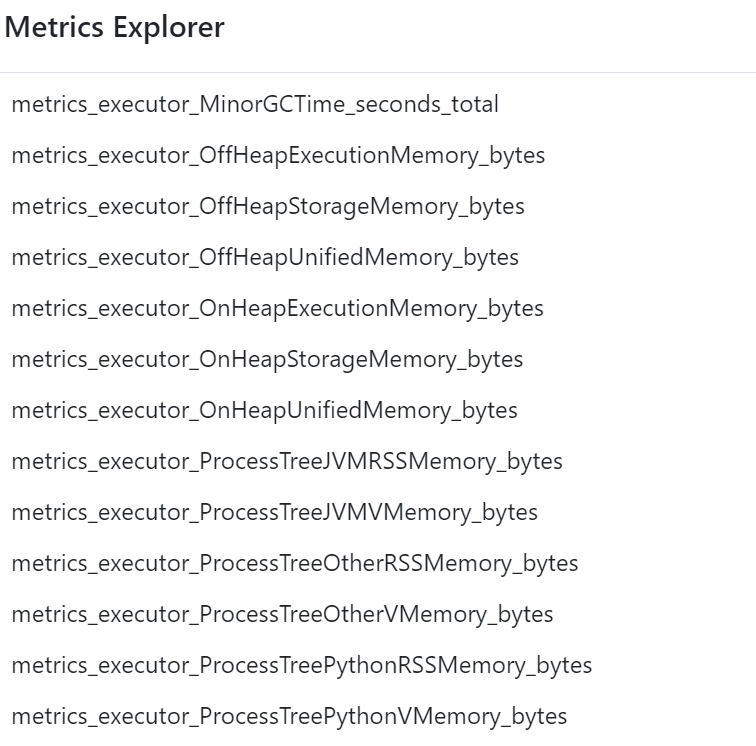
我能够通过下面的API获得主机/infra指标,如内存、磁盘等。
https://eastus-c3.databricks.net/driver-proxy-api/o/<org-id>/<cluster-id>/40001/metrics/executors/prometheus我找不到任何apis或引用来获取流度量、处理信息等。对于如何将这些流UI度量获取到prometheus,有什么帮助吗?
星星之火:
spark.ui.prometheus.enabled true
spark.sql.streaming.metricsEnabled true
下面是prometheus配置文件:
# my global config
global:
  scrape_interval: 15s # Set the scrape interval to every 15 seconds. Default is every 1 minute.
  evaluation_interval: 15s # Evaluate rules every 15 seconds. The default is every 1 minute.
  # scrape_timeout is set to the global default (10s).

# Alertmanager configuration
alerting:
  alertmanagers:
    - static_configs:
        - targets:
          # - alertmanager:9093

# Load rules once and periodically evaluate them according to the global 'evaluation_interval'.
rule_files:
  # - "first_rules.yml"
  # - "second_rules.yml"

# A scrape configuration containing exactly one endpoint to scrape:
# Here it's Prometheus itself.
scrape_configs:
  - job_name: 'prometheus'
    scheme: https
    scrape_interval: 5s
    static_configs:
      - targets: ['eastus-c3.azuredatabricks.net']
    metrics_path: '/driver-proxy-api/o/<orgid>/<clusterid>/40001/metrics/executors/prometheus'
    basic_auth:
      username: 'token'
      password: 'user gen token'
回答 1
Stack Overflow用户
回答已采纳
发布于 2022-11-26 06:41:09
流度量是从驱动程序发出的,而不是从执行者发出的。
试试/driver-proxy-api/o/<orgid>/<clusterid>/40001/metrics/prometheus。
对于驱动程序度量,您需要启用PrometheusServlet。您可以通过附加init脚本在Databricks上这样做,如下所示:
#!/bin/bash
cat << EOF > /databricks/spark/conf/metrics.properties
*.sink.prometheusServlet.class=org.apache.spark.metrics.sink.PrometheusServlet
*.sink.prometheusServlet.path=/metrics/prometheus
master.sink.prometheusServlet.path=/metrics/master/prometheus
applications.sink.prometheusServlet.path=/metrics/applications/prometheus
EOF页面原文内容由Stack Overflow提供。腾讯云小微IT领域专用引擎提供翻译支持
原文链接:
https://stackoverflow.com/questions/74562163
复制相关文章
相似问题
腾讯云开发者

Copyright © 2013 - 2026 Tencent Cloud. All Rights Reserved. 腾讯云 版权所有
深圳市腾讯计算机系统有限公司 ICP备案/许可证号:粤B2-20090059 ![]() 粤公网安备44030502008569号
粤公网安备44030502008569号
腾讯云计算(北京)有限责任公司 京ICP证150476号 | 京ICP备11018762号