
使用数据帧中条形图的起始点和结束点创建框图
使用数据帧中条形图的起始点和结束点创建框图
提问于 2022-11-22 02:18:58
我正在尝试创建一个盒图,但每个因素只有两个值,我想要将其用作盒图栏的起点和结束点。
我有一个数据框架(df),如下所示:
   ID            **spp**     **lrr**             Est                SE
1  25           species 1    -1.029      -0.423814246776361   0.309105763160605
2  25           species 1    0.1820      -0.423814246776361   0.309105763160605
5  24           species 2    -3.694      -1.67397643357167    1.03077640640442
6  24           species 2    0.3463      -1.67397643357167    1.03077640640442
7  21           species 3    0.5181      2.484906649788       1.4142135623731
8 21 species 3 4.4516 2.484906649788 1.4142135623731我需要每个物种的酒吧(spp)使用lrr中的值。例如,我希望从物种1到范围从-1.029到0.1820,从物种2到-3.694到0.3463等等。
我尝试使用以下代码:
ggplot(df) +
  aes(x = lrr, y = spp) +
  geom_boxplot() +
  theme_minimal()
然而,它并没有为每个物种创建一个单一的条,而是创建了两个独立的点。我还尝试通过两个lrr列(一个用于起始点,一个用于端点)重新排列数据:
   ID            **spp**     **lrr1**      **lrr2**            Est                SE
1  25           species 1    -1.029         0.1820     -0.423814246776361   0.309105763160605
5  24           species 2    -3.694         0.3463     -1.67397643357167    1.03077640640442
7  21           species 3    0.5181         4.4516     2.484906649788       1.4142135623731
然而,我仍然不知道如何强迫酒吧进入起点和终点。任何帮助都是非常感谢的。
回答 2
Stack Overflow用户
发布于 2022-11-22 04:11:53
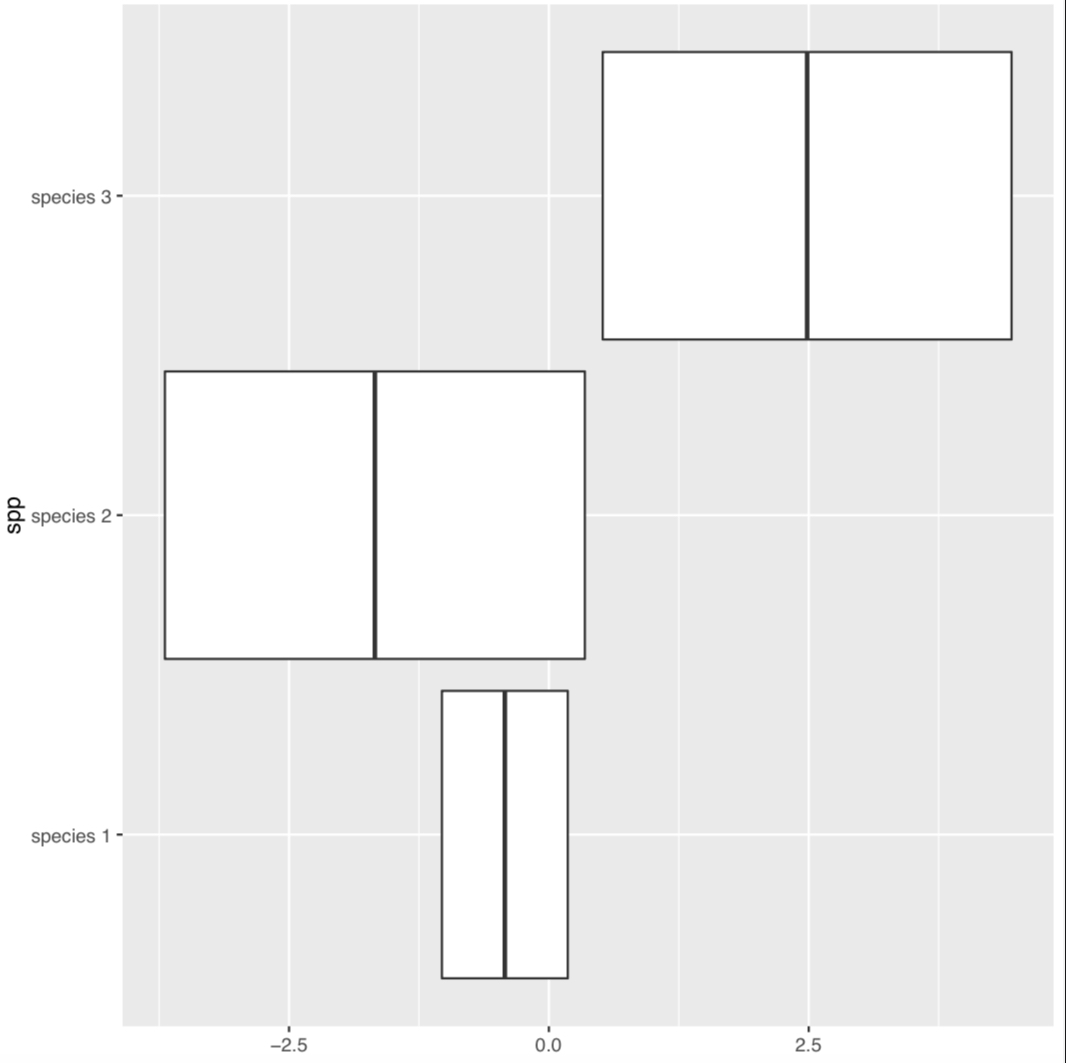
使用wide,您可以在stat = "identity"中设置geom_boxplot()并手动设置you图参数:
library(ggplot2)

ggplot(df_wide) +
  geom_boxplot(
    aes(
      y = spp,
      xmin = lrr1, xlower = lrr1,
      xupper = lrr2, xmax = lrr2,
      xmiddle = (lrr1 + lrr2)/2
    ),
    stat = "identity"
  )
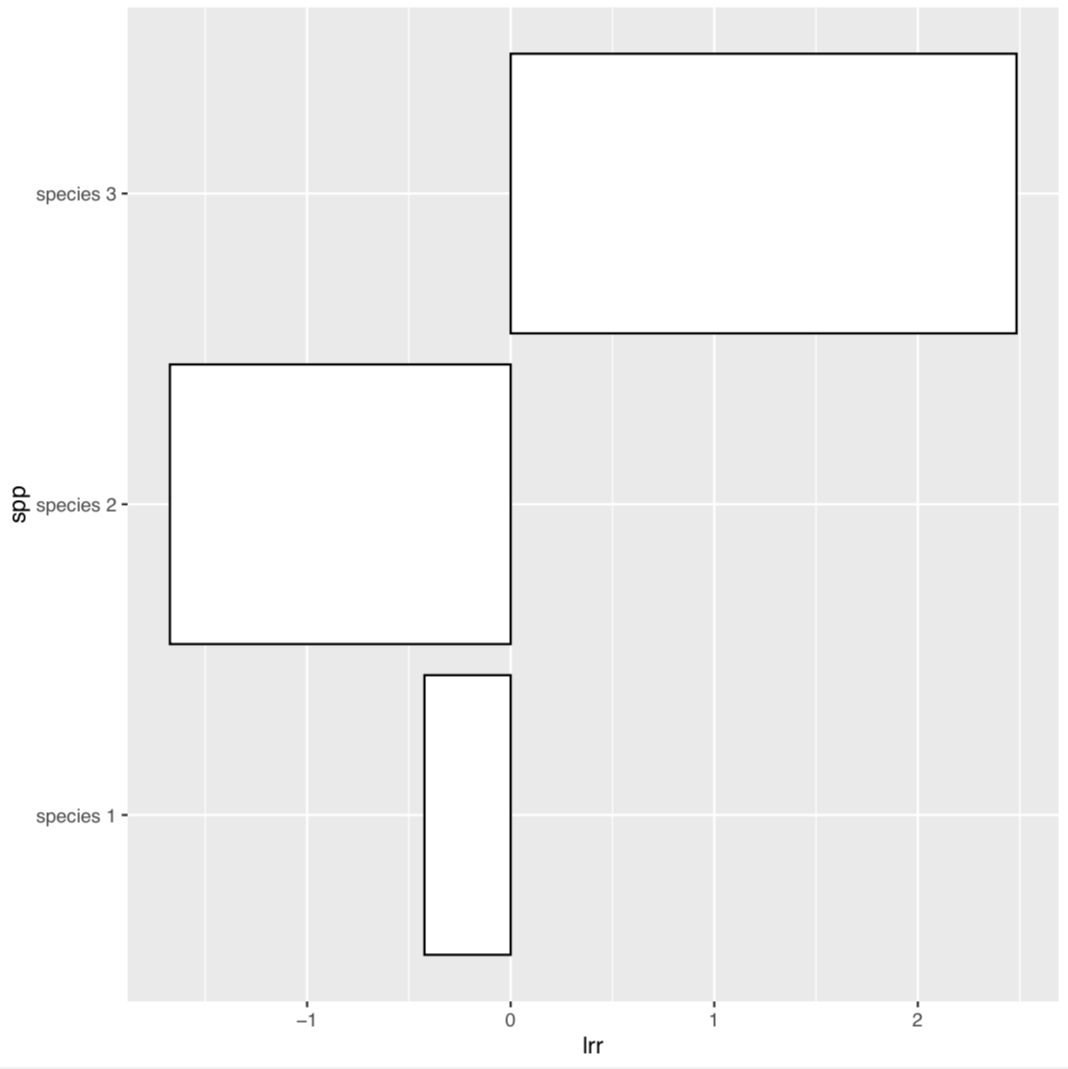
但是,如果您不关心中间栏,那么使用geom = "bar"在stat_summary()中的原始(长)数据可能会更容易
ggplot(df, aes(lrr, spp)) +
  stat_summary(
    fun.min = min,
    fun = median,
    fun.max = max,
    geom = "bar",
    color = "black",
    fill = "white"
  )
Stack Overflow用户
发布于 2022-11-22 04:08:28
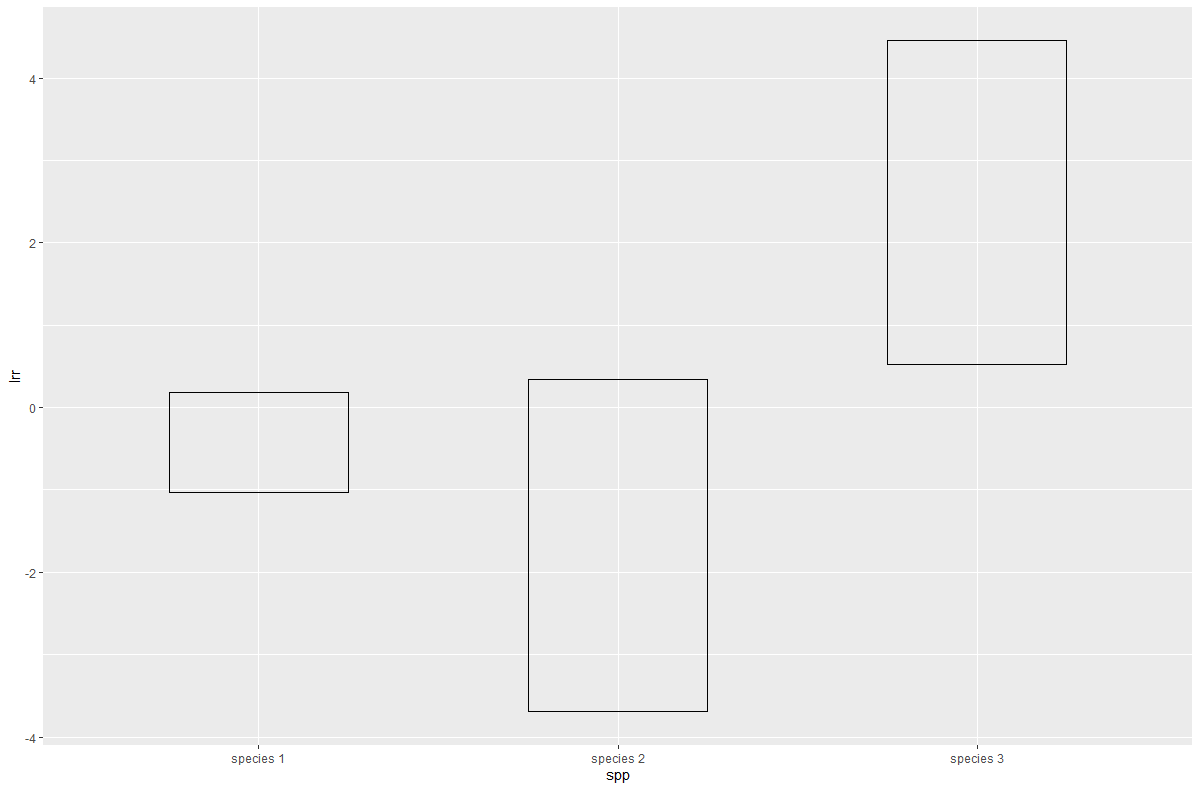
就像这样,用geom_crossbar?
library(dplyr)
library(ggplot2)
library(scales)

df1 %>%
  group_by(spp) %>%
  mutate(upper = max(lrr),
         lower = min(lrr)) %>%
  ungroup() %>%
  ggplot(aes(spp, lrr)) +
  geom_crossbar(aes(ymin = lower,
                    ymax = upper),
                fatten = 1,
                width = 0.5) +
  scale_y_continuous(breaks = pretty_breaks())
结果:
数据:
df1 <- structure(list(ID = c(25L, 25L, 24L, 24L, 21L, 21L), spp = c("species 1",
"species 1", "species 2", "species 2", "species 3", "species 3"
), lrr = c(-1.029, 0.182, -3.694, 0.3463, 0.5181, 4.4516), Est = c(-0.423814246776361,
-0.423814246776361, -1.67397643357167, -1.67397643357167, 2.484906649788,
2.484906649788), SE = c(0.309105763160605, 0.309105763160605,
1.03077640640442, 1.03077640640442, 1.4142135623731, 1.4142135623731
)), class = "data.frame", row.names = c("1", "2", "5", "6", "7",
"8"))页面原文内容由Stack Overflow提供。腾讯云小微IT领域专用引擎提供翻译支持
原文链接:
https://stackoverflow.com/questions/74526841
复制相关文章
相似问题
腾讯云开发者

Copyright © 2013 - 2026 Tencent Cloud. All Rights Reserved. 腾讯云 版权所有
深圳市腾讯计算机系统有限公司 ICP备案/许可证号:粤B2-20090059 ![]() 粤公网安备44030502008569号
粤公网安备44030502008569号
腾讯云计算(北京)有限责任公司 京ICP证150476号 | 京ICP备11018762号