
如何在降序ggplot2中重新排序数据轴
“”我正在制作甘特图。
如果我按升序日期重新排序,则图表绘制得很好,但我希望遵循甘特图惯例,并将任务按x轴日期降序绘制在y轴上。如果按降序重新排序,则会得到错误消息:
geom_line()中的错误:!计算美学中的问题。ℹ错误发生在第一层。由-.Date:!中的错误引起的occurred未为运行rlang::last_error()的“日期”对象定义以查看错误发生的位置。
##create dataframe## gantt <- data.frame(Tasks = c('Refine analysis plan', 'Retrieve data', 'Identify cases using SNOMED codes and study start/end dates', 'Retrieve clinical and referral events', 'Retrieve covariate data', 'Table of cohort characteristics and outcome frequencies','Age and gender distribution of incident cases (fig1)','Age and gender distribution of prevalent cases (fig2)', 'Prepare and submit abstract','PPIE work 2', 'Frequency of referrals (staff) (fig3)','Frequency of 2care referrals (staff) (fig4)','Frequency of 2care referrals (diagnosis category) (fig5)', 'Descriptive paper draft for coauthor review', 'Regression analysis of predictors 1', 'Regression analysis of predictors 2', 'Regression analysis of predictors 3', 'Modelling paper draft for coauthor review','conference','Modelling paper draft for coauthor review', 'Submit papers to BJGP','Respond to reviewer comments','PPIE work 3'), start.date = as.Date(c("2022-11-01", "2022-11-14", "2022-11-16", "2022-11-18", "2022-12-01", "2023-01-02","2023-01-09","2023-01-19", "2023-02-01","2023-02-16", "2023-03-01", "2023-03-13", "2023-03-23", "2023-04-03", "2023-05-01", "2023-05-15", "2023-05-25", "2023-06-01", "2023-07-03","2023-07-18","2023-07-21", "2023-08-01","2023-08-01")), end.date = as.Date(c("2022-11-14", "2022-11-16", "2022-11-17", "2022-11-30", "2022-12-16", "2023-01-06","2023-01-18","2023-01-31", "2023-02-15","2023-02-28", "2023-03-10", "2023-03-22", "2023-03-31", "2023-04-28", "2023-05-12", "2023-05-24", "2023-05-30", "2023-06-30", "2023-07-17","2023-07-20","2023-07-31", "2023-08-31","2023-08-31")), task\_type = c("Planning","Data preparation","Data preparation", "Data preparation","Data preparation","Data description","Data visualisation", "Data visualisation","Dissemination & communication","Patient & public involvement and engagement", "Data visualisation","Data visualisation","Data visualisation", "Dissemination & communication","Data analysis/modelling","Data analysis/modelling","Data analysis/modelling", "Dissemination & communication","Dissemination & communication","Dissemination & communication", "Dissemination & communication","Dissemination & communication","Patient & public involvement and engagement")) gantt$duration<-gantt$end.date - gantt$start.date gantt$name gantt$Tasks <- factor( gantt$Tasks , ordered = TRUE ) #create gantt chart mgantt <- gantt%>% tidyr::pivot\_longer(col = c(start.date,end.date)) pl <- ggplot(mgantt, aes(x = value, y = reorder(Tasks,-value), colour = task\_type )) pl <- pl + geom\_line( alpha = 0.5, size = 7) pl <- pl + theme\_bw() pl <- pl + labs(title = "Gantt Chart") pl <- pl + labs(x = "Month") pl <- pl + labs(y = "Tasks") pl <- pl + theme(legend.position = "bottom") pl <- pl + scale\_x\_date(name = "Month" date\_labels = "%b%y" date\_breaks = "1 month" minor\_breaks = "1 day") pl
回答 1
Stack Overflow用户
发布于 2022-11-10 10:55:50
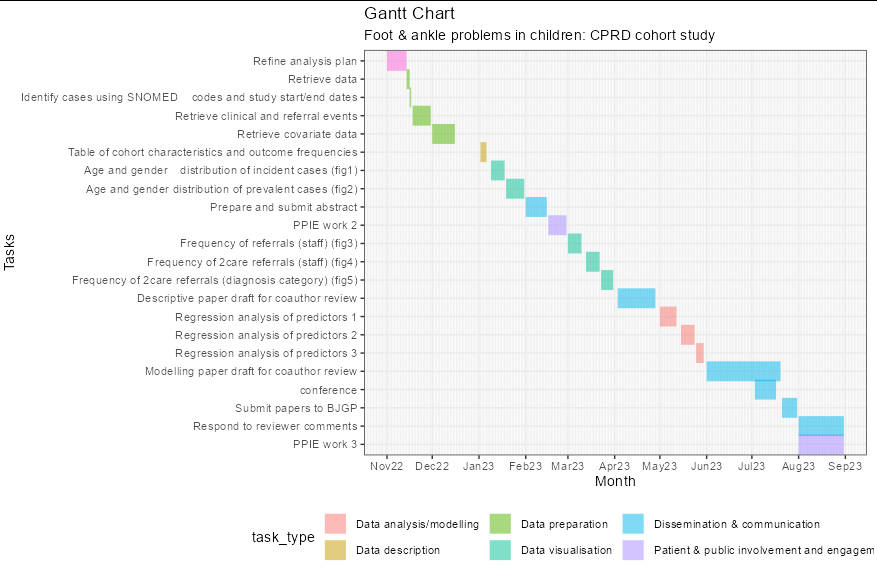
你可以通过reorder -as.numeric(value)
ggplot(mgantt, aes(x = value, y = reorder(Tasks, -as.numeric(value)),
                   colour = task_type )) +
  geom_line( alpha = 0.5, size = 7) +
  theme_bw() +
  labs(title = "Gantt Chart") +
  labs(subtitle = "Foot & ankle problems in children: CPRD cohort study") +
  labs(x = "Month") +
  labs(y = "Tasks") +
  theme(legend.position = "bottom") +
  scale_x_date(name = "Month",
               date_labels = "%b%y",
               date_breaks = "1 month",
               minor_breaks = "1 day")
https://stackoverflow.com/questions/74387740
复制相似问题
腾讯云开发者

Copyright © 2013 - 2026 Tencent Cloud. All Rights Reserved. 腾讯云 版权所有
深圳市腾讯计算机系统有限公司 ICP备案/许可证号:粤B2-20090059 ![]() 粤公网安备44030502008569号
粤公网安备44030502008569号
腾讯云计算(北京)有限责任公司 京ICP证150476号 | 京ICP备11018762号