
如何使用ggplot2对盒子和晶须图形中的不同颜色和图案进行编码?
如何使用ggplot2对盒子和晶须图形中的不同颜色和图案进行编码?
提问于 2022-11-08 22:29:14
我有关于叶绿素的数据--一种来自两大类浮游植物的生物量:“WSW”和“<20m”级。数据还按墨西哥湾各地区分列(共计5个)。每个区域都具有WSW和<20m值。我试图得到一个方格图来显示每个地区的生物量数据。每个区域都需要一定的颜色,但这不允许区分大小类,所以我选择向其中一个size类添加一个模式。到目前为止,我的代码如下:
patterns <- c('<20 µm' = 'crosshatch', 'WSW' = 'none')
region_colors <- c('WFS' = 'darkgreen', 'TLS' = 'cyan3', 'EMS' = 'orangered2', 'CB' = 'yellow3', 'YC/FS' = 'plum2')

surf.box.fig <- ggplot(surf_box, aes(x=region, y = Chla, fill = Size)) + geom_boxplot() +
  scale_pattern_fill_manual(values = region_colors) + scale_pattern_manual(values = patterns) +
  theme(panel.background = element_blank(),
        legend.position = 'top',
        axis.line.x = element_line(color="black", size = 1),
        axis.line.y = element_line(color="black", size = 1),
        plot.title = element_text(margin = margin(t = 0, r = 0, b = 0, l = 0),
            hjust = 0.5, size = 15, face = 'bold'),
        legend.key=element_blank(),
        legend.title = element_text(margin = margin(t = 0, r = 0, b = 0, l = 0),
        size=10, face = "bold")) +
  labs(x=expression(bold(paste("Regions of the Gulf of Mexico"))),
       y=expression(bold(paste("Chl-",bolditalic ("a"), " biomass (µg L"^'-1',')'))),
       title = expression(bold(paste("Surface Chl-", bolditalic ("a"), ' Biomass'))))
这就是结果
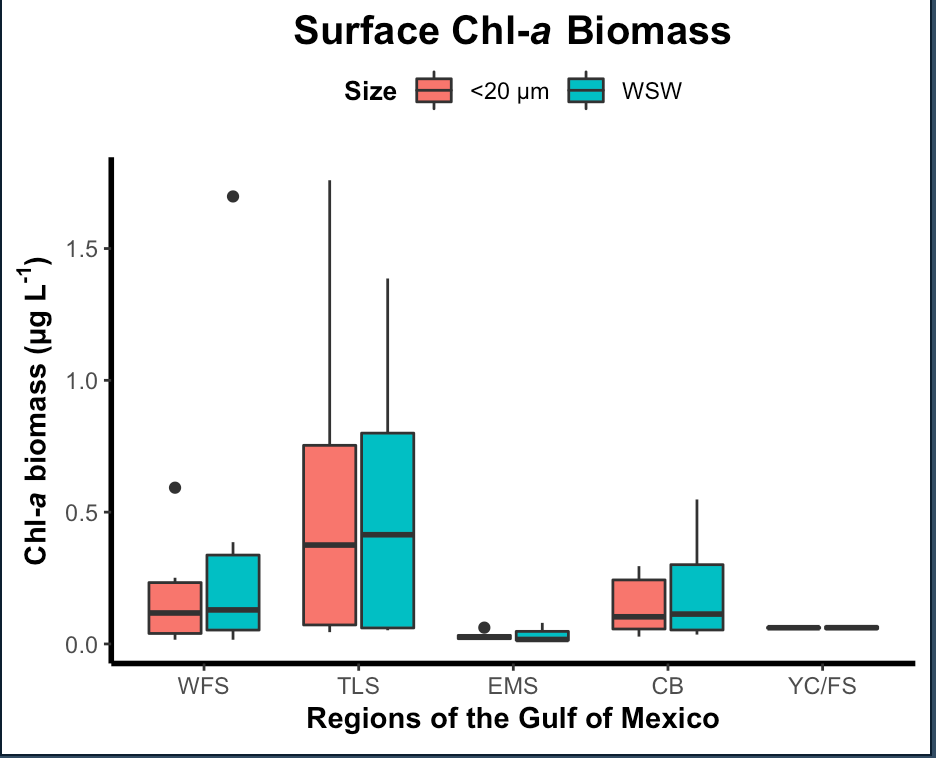
我试着用"region“代替fill选项,但这也不起作用。以下是数据:
数据:
structure(list(Size = c("WSW", "WSW", "WSW", "WSW", "WSW", "WSW",
"WSW", "WSW", "WSW", "WSW", "WSW", "WSW", "WSW", "WSW", "WSW",
"WSW", "WSW", "WSW", "WSW", "WSW", "WSW", "WSW", "WSW", "WSW",
"WSW", "<20 µm", "<20 µm", "<20 µm", "<20 µm", "<20 µm",
"<20 µm", "<20 µm", "<20 µm", "<20 µm", "<20 µm", "<20 µm",
"<20 µm", "<20 µm", "<20 µm", "<20 µm", "<20 µm", "<20 µm",
"<20 µm", "<20 µm", "<20 µm", "<20 µm", "<20 µm", "<20 µm",
"<20 µm", "<20 µm"), Chla = c(0.0158553374250702, 0.0681835535205316,
1.69758559710116, 0.38623655064116, 0.18999889055035, 0.0475280806809533,
0.0518441820414833, 1.38653044994664, 0.811092911431239, 0.0627435113039509,
0.0600206049988672, 0.76576153727216, 0.0131834301368552, 0.0139065718743198,
0.0801018539960821, 0.0476673877342761, 0.0170883088104008, 0.0353610062847066,
0.0862740442259294, 0.54829425475163, 0.354272113611421, 0.0419050024352668,
0.14044768258058, 0.0693766746908316, 0.0539223064788303, 0.0159113633523673,
0.033895686014726, 0.592754310802978, 0.251252264220314, 0.177521351469432,
0.0574533958589567, 0.0447197172789116, 1.75919476060424, 0.789171481392557,
0.104392221393643, 0.0613148498505948, 0.646043888487357, 0.0200254634990205,
0.0165766336741892, 0.0619120579844718, 0.0324340598144779, 0.0264756363476934,
0.0276985089356931, 0.105004593301296, 0.288904529677619, 0.295226761342851,
0.0419623280199936, 0.10089302911911, 0.0580098748827292, 0.0647851594974109
), region = structure(c(1L, 1L, 1L, 1L, 1L, 1L, 2L, 2L, 2L, 2L,
2L, 2L, 3L, 3L, 3L, 3L, 3L, 4L, 4L, 4L, 4L, 4L, 4L, 5L, 5L, 1L,
1L, 1L, 1L, 1L, 1L, 2L, 2L, 2L, 2L, 2L, 2L, 3L, 3L, 3L, 3L, 3L,
4L, 4L, 4L, 4L, 4L, 4L, 5L, 5L), .Label = c("WFS", "TLS", "EMS",
"CB", "YC/FS"), class = c("ordered", "factor")), depth_name = c("Surface",
"Surface", "Surface", "Surface", "Surface", "Surface", "Surface",
"Surface", "Surface", "Surface", "Surface", "Surface", "Surface",
"Surface", "Surface", "Surface", "Surface", "Surface", "Surface",
"Surface", "Surface", "Surface", "Surface", "Surface", "Surface",
"Surface", "Surface", "Surface", "Surface", "Surface", "Surface",
"Surface", "Surface", "Surface", "Surface", "Surface", "Surface",
"Surface", "Surface", "Surface", "Surface", "Surface", "Surface",
"Surface", "Surface", "Surface", "Surface", "Surface", "Surface",
"Surface"), distance = c("Offshore", "Offshore", "Nearshore",
"Nearshore", "Intermediate", "Offshore", "Offshore", "Nearshore",
"Nearshore", "Intermediate", "Intermediate", "Nearshore", "Nearshore",
"Intermediate", "Offshore", "Intermediate", "Offshore", "Offshore",
"Intermediate", "Nearshore", "Nearshore", "Offshore", "Intermediate",
"Offshore", "Intermediate", "Offshore", "Offshore", "Nearshore",
"Nearshore", "Intermediate", "Offshore", "Offshore", "Nearshore",
"Nearshore", "Intermediate", "Intermediate", "Nearshore", "Nearshore",
"Intermediate", "Offshore", "Intermediate", "Offshore", "Offshore",
"Intermediate", "Nearshore", "Nearshore", "Offshore", "Intermediate",
"Offshore", "Intermediate")), row.names = c(NA, -50L), class = c("tbl_df",
"tbl", "data.frame"))回答 1
Stack Overflow用户
发布于 2022-11-08 23:53:30
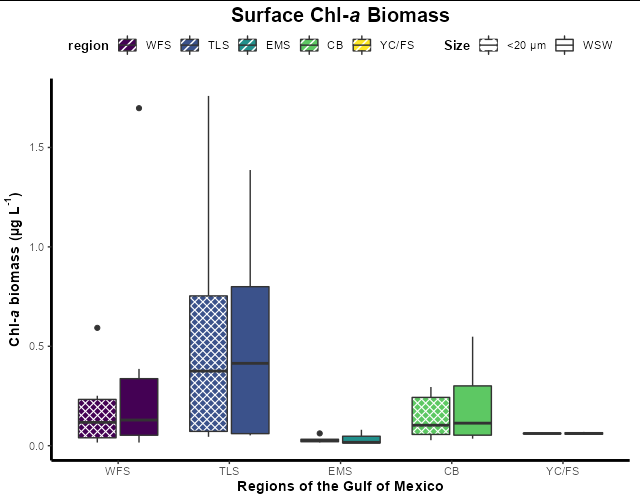
也许是这样的?
library(ggpattern)

ggplot(surf_box, aes(x = region, y = Chla, fill = region, pattern = Size)) +
  geom_boxplot_pattern(pattern_fill = "white", pattern_color = "white",
                       pattern_angle = 45, pattern_size = 0,
                       pattern_spacing = 0.015) +
  scale_pattern_fill_manual(values = region_colors) +
  scale_pattern_manual(values = patterns) +
  theme(panel.background = element_blank(),
        legend.position = 'top',
        axis.line.x = element_line(color="black", size = 1),
        axis.line.y = element_line(color="black", size = 1),
        plot.title = element_text(margin = margin(t = 0, r = 0, b = 0, l = 0),
                                  hjust = 0.5, size = 15, face = 'bold'),
        legend.key = element_blank(),
        legend.title = element_text(margin = margin(t = 0, r = 0, b = 0, l = 0),
                                    size = 10, face = "bold")) +
  labs(x=expression(bold(paste("Regions of the Gulf of Mexico"))),
       y=expression(bold(paste("Chl-",bolditalic ("a"),
                               " biomass (µg L"^'-1',')'))),
       title = expression(bold(paste("Surface Chl-",
                                     bolditalic ("a"), ' Biomass'))))
页面原文内容由Stack Overflow提供。腾讯云小微IT领域专用引擎提供翻译支持
原文链接:
https://stackoverflow.com/questions/74367857
复制相关文章
相似问题
腾讯云开发者

Copyright © 2013 - 2026 Tencent Cloud. All Rights Reserved. 腾讯云 版权所有
深圳市腾讯计算机系统有限公司 ICP备案/许可证号:粤B2-20090059 ![]() 粤公网安备44030502008569号
粤公网安备44030502008569号
腾讯云计算(北京)有限责任公司 京ICP证150476号 | 京ICP备11018762号