
在R中创建一个创建新向量的循环
在R中创建一个创建新向量的循环
提问于 2022-11-07 20:19:31
我有70个病人的数据集。在6个不同的数据点,获得了2个可能相互关联的实验室值。在这里您可以看到一些提取的数据。
id w2_crp w2_alb w6_crp w6_alb w10_crp w10_alb
001 1.2 35 1.1 38 0.5 39
002 10 27 0.5 42.5 0.5 40
003 2.4 30 1.7 30 1.2 32
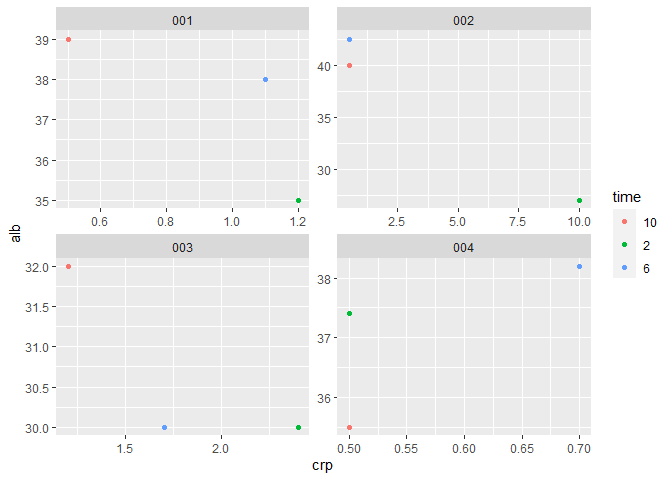
004 0.5 37.4 0.7 38.2 0.5 35.5对于每个病人,我想在相应的时间点绘制x轴上的crp值和y轴上的白蛋白值。
我为10个第一个ID制作了这些向量:
vec1 <- pull(df, w2_crp)
vec2 <- pull(df, w2_alb)
...

crp1 <- (c(first(vec1)), (first(vec3)), (first(vec5))) 和白蛋白相似的载体,并且通常用plot_ly(df, x ~crp1, y ~alb1, type = "scatter", mode = "lines")作图,但这显然是非常乏味的。您有什么想法吗?如何用for循环来自动创建向量并将它们绘制成图呢?我试过了但经常出错..。我很感谢你的帮助!
回答 1
Stack Overflow用户
发布于 2022-11-07 23:28:00
我假设列名中的数字是时间点。如果是这样,你可以这样做:
library(tidyverse)

#example data
dat <- read_table("id     w2_crp     w2_alb    w6_crp     w6_alb     w10_crp     w10_alb
001     1.2       35         1.1        38         0.5         39
002      10       27          0.5         42.5      0.5         40
003     2.4       30         1.7        30          1.2         32
004      0.5      37.4       0.7         38.2        0.5        35.5")

#make each timepoint a row and each group a column
new_dat <- dat |>
  pivot_longer(-id, names_pattern="\\w(\\d+)_(\\w+)",
               names_to = c("time", "type")) |>
  pivot_wider(names_from = type, values_from = value)

new_dat
#> # A tibble: 12 x 4
#>    id    time    crp   alb
#>    <chr> <chr> <dbl> <dbl>
#>  1 001   2       1.2  35
#>  2 001   6       1.1  38
#>  3 001   10      0.5  39
#>  4 002   2      10    27
#>  5 002   6       0.5  42.5
#>  6 002   10      0.5  40
#>  7 003   2       2.4  30
#>  8 003   6       1.7  30
#>  9 003   10      1.2  32
#> 10 004   2       0.5  37.4
#> 11 004   6       0.7  38.2
#> 12 004   10      0.5  35.5

#plot data
new_dat|>
  ggplot(aes(crp, alb, color = time))+
  geom_point()+
  facet_wrap(~id, scales = "free")
页面原文内容由Stack Overflow提供。腾讯云小微IT领域专用引擎提供翻译支持
原文链接:
https://stackoverflow.com/questions/74352487
复制相关文章
相似问题
腾讯云开发者

Copyright © 2013 - 2026 Tencent Cloud. All Rights Reserved. 腾讯云 版权所有
深圳市腾讯计算机系统有限公司 ICP备案/许可证号:粤B2-20090059 ![]() 粤公网安备44030502008569号
粤公网安备44030502008569号
腾讯云计算(北京)有限责任公司 京ICP证150476号 | 京ICP备11018762号