
用实际数据引导hclust
用实际数据引导hclust
提问于 2022-11-02 08:31:39
我有一个数据集,其中包含对每个类别的多个观察:
country PC1 PC2 PC3 PC4 PC5
BD  0.0960408090569664  0.373740208940467   -0.369920989335273  -1.02993010449105   -0.481901935725247
BD  -0.538617581045194  0.537010643603669   0.447050616992454   -1.3888975041278    -0.759524281163431
PK  -0.452943925236246  0.507244835779749   0.64679762176707    -1.38054973938184   -0.278384245105666
PK  -1.01487954986928   0.737191371806965   -0.202656866687033  -1.22663700666619   0.186305912881529
UK  -0.377594639422628  0.817593863033578   0.3739216019342 -1.73856626173224   1.12404906217336
UK  -0.636564327570674  0.714647668634421   1.00488527275837    -1.4344227886331    0.637219423443802
US  -0.775649983771687  0.0900448150403809  0.243317360780493   -1.72498526814162   -0.618714136277983
US -0.372815509141658 0.419096654055852 0.904247466040119 -0.573219421959129 -0.0154666267035251我希望在R中对其进行分层聚类分析,这样只有4个节点(对应于4个级别的country)。我唯一能想到的方法就是取列的平均值(PC1,PC2.)基于country,然后在R中运行hclust,因为我对每个分类变量有多个观察(每个级别至少有200个),所以我希望对数千个子样本(通过对每个分类变量随机选择一个观察)运行分层聚类分析的引导版本,然后运行hclust,然后得到最终结果。我遇到了以下引导聚类的方法。普克罗斯特似乎对此数据的摘要版本很有用。ClusterBootstrap和布克罗斯特对我的场景也不太有用。有什么想法吗?我如何使用实际观察的子样本来运行引导程序,而不是使用/without替换的总结版本?
回答 1
Stack Overflow用户
发布于 2022-11-02 20:49:35
引导聚类分析是可能的,具体如下:
library(future)
plan(multisession)
library(shipunov)
library(dplyr)
data = data.frame(country = c(rep("PK", 10), rep("UK", 10), rep("US", 10), rep("BD", 10), rep("IN", 10)),
"PC1" = runif(n = 50, min = -2, max = 3),
"PC2" = runif(n = 50, min = -2.5, max = 4),
"PC3" = runif(n = 50, min = -4, max = 2))
#original that will be used for comparison
d1 = data |>
dplyr::group_by(country) |>
dplyr::summarise_if(is.numeric, mean) |>
tibble::column_to_rownames(var="country") |>
data.frame()
dist_mat <- dist(d1, method = 'euclidean')
list_of_hc <- furrr::future_map(1:20000, function(i) {
print(i)
##create a dataframe with replacement using original df and summarize it
d = data |> group_by(country) |> slice_sample(prop = 1, replace=TRUE) |>
ungroup() |>
dplyr::group_by(country) |>
dplyr::summarise_if(is.numeric, mean) |>
tibble::column_to_rownames(var="country")
##run hclust on the data
dist_mat = dist(d, method = 'euclidean')
hc = hclust(dist_mat)
##save the hclust result to a list
hc}, .progress = TRUE)
#first element of the list is based on original df
list_of_hc[[1]] <- hclust(dist_mat)
#use Bclust to calculate similarity b/w the original (first element) and subsequent bootstrapped hclust
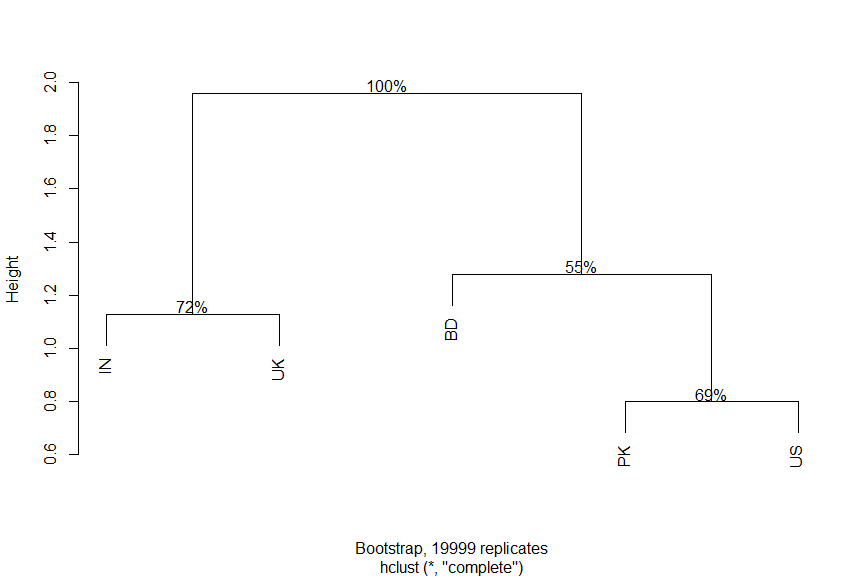
(bb3 <- Bclust(hclist=list_of_hc, relative = TRUE))
plot(bb3)结果:
页面原文内容由Stack Overflow提供。腾讯云小微IT领域专用引擎提供翻译支持
原文链接:
https://stackoverflow.com/questions/74286316
复制相关文章
相似问题
腾讯云开发者

Copyright © 2013 - 2026 Tencent Cloud. All Rights Reserved. 腾讯云 版权所有
深圳市腾讯计算机系统有限公司 ICP备案/许可证号:粤B2-20090059 ![]() 粤公网安备44030502008569号
粤公网安备44030502008569号
腾讯云计算(北京)有限责任公司 京ICP证150476号 | 京ICP备11018762号