
如何编辑有多个图例的条形图例?
如何编辑模式的图例,同时保留其他图例,就像使用ggpatterns时一样?
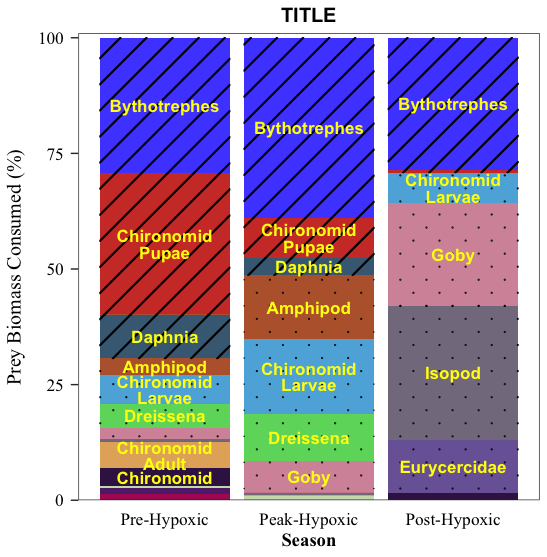
我有以下情节:
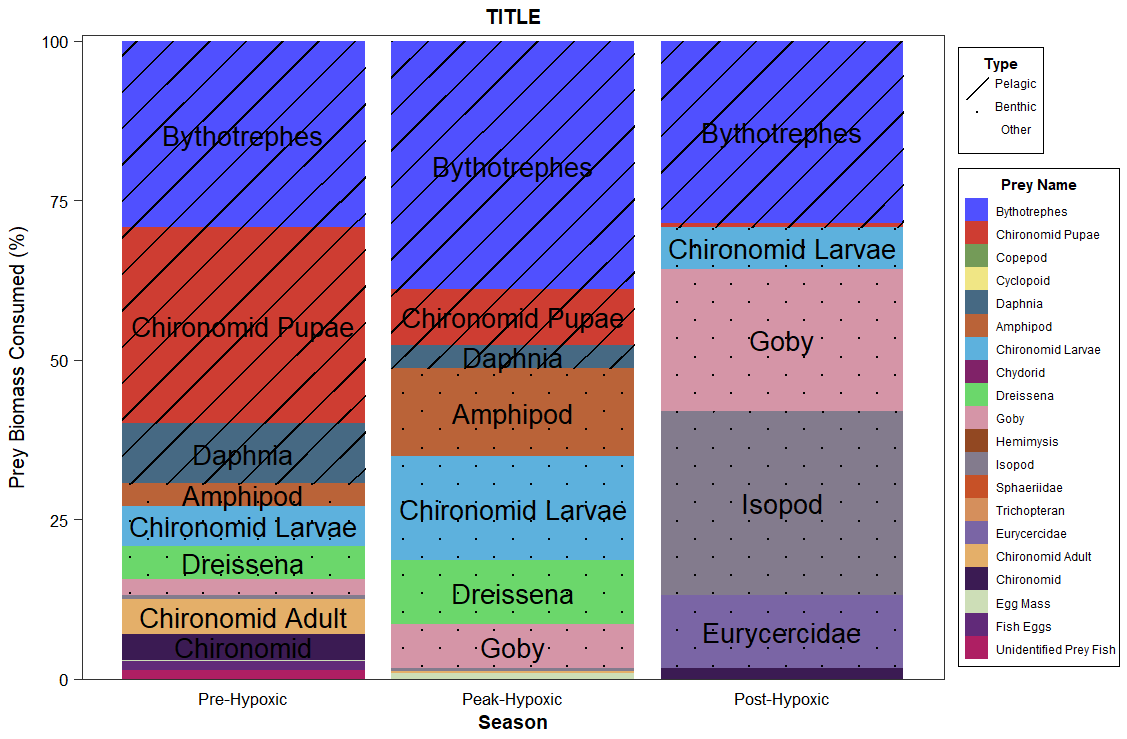
我使用了以下代码来制作这个情节:
ggplot(try2, aes(Season, prey_frq, fill=PreyName, pattern = Type)) +
  geom_bar_pattern(stat = "identity",
                   pattern_fill = "black",
                   pattern_color = "black",
                   pattern_angle = 45,
                   pattern_density = 0.04,
                   pattern_spacing = 0.04,
                   pattern_key_scale_factor = 0.6) +
  geom_text(data = subset(try2, prey_frq>3),
            aes(y = pos_label,
                label = PreyName), face = "bold", size = 7) +
  scale_pattern_manual(values = list,
                       c('Other' = 'none', 'Pelagic' = 'stripe', 'Benthic' = 'circle')) +
  ggtitle("TITLE") +
  labs(x="Season", fill = "Prey Name", y = "Prey Biomass Consumed (%)") +
  scale_fill_igv(palette = "default") +
  guides(pattern = guide_legend(
    title = "Type",
    #direction = "horizontal",
    title.position = "top",
    label.position = "right",
    label.hjust = 0.5,
    label.vjust = 1
    #label.theme = element_text(angle = 90)
    , override.aes = list(fill = "white"), order = 2),
    fill = guide_legend(override.aes = list(pattern = "none", order = 1))) +
  theme_bw() +
  theme(legend.position = "right",
        plot.title = element_text(hjust=0.5, face = "bold", family = "Arial",
                                  size=15),
        legend.background = element_rect(fill = "white", color = 1),
        legend.title.align = 0.5,
        legend.title = element_text(face = "bold"),
        axis.title.y = element_text(size = 15,
                                    margin = margin(t = 0, r = 10, b = 0, l = 0),
                                    color = "black"),
        axis.title.x.top = element_text(size = 14,
                                        margin = margin(t = 0, r = 0, b = 10, l = 0),
                                        color = "black"),
        text = element_text(family = "Times New Roman"),
        axis.text.y = element_text(color = "black",
                                   size = 13,
                                   angle = 0,
                                   vjust = 0.5,
                                   hjust = 1,
                                   margin = margin(t = 0, r = 5, b = 0, l = 0)),
        axis.text.x = element_text(color = "black",
                                   size = 13,
                                   angle = 0,
                                   vjust = 1.5,
                                   hjust = 0.5,
                                   margin = margin(t = 5, r = 0, b = 0, l = 0)),
        axis.title.x = element_text(size = 14,
                                    face = "bold"),
        axis.ticks.x = element_blank(),
        plot.background = element_blank(),
        panel.grid.major = element_blank(),
        panel.grid.minor = element_blank(),
        axis.ticks.length = unit(0.2,"cm")) +
  scale_y_continuous(expand = expansion(mult = c(0,0.01)))
我的数据:
structure(list(Season = structure(c(1L, 1L, 1L, 1L, 1L, 1L, 1L,  1L, 1L, 1L, 1L, 1L, 1L, 1L, 1L, 1L, 1L, 1L, 2L, 2L, 2L, 2L, 2L,  2L, 2L, 2L, 2L, 2L, 2L, 3L, 3L, 3L, 3L, 3L, 3L, 3L), levels = c("Pre-Hypoxic", "Peak-Hypoxic", "Post-Hypoxic"), class = "factor"), PreyName = structure(c(1L,  2L, 3L, 4L, 5L, 6L, 7L, 8L, 9L, 10L, 12L, 13L, 14L, 16L, 17L,  18L, 19L, 20L, 1L, 2L, 5L, 6L, 7L, 9L, 10L, 11L, 12L, 16L, 18L,  1L, 2L, 7L, 10L, 12L, 15L, 17L), levels = c("Bythotrephes", "Chironomid Pupae",  "Copepod", "Cyclopoid", "Daphnia", "Amphipod", "Chironomid Larvae",  "Chydorid", "Dreissena", "Goby", "Hemimysis", "Isopod", "Sphaeriidae",  "Trichopteran", "Eurycercidae", "Chironomid Adult", "Chironomid",  "Egg Mass", "Fish Eggs", "Unidentified Prey Fish"), class = "factor"),
    prey_tot = c(17.227374302, 18.112509605, 0.04050358, 0.005066528,
    5.523993801, 2.136988844, 3.658250957, 0.002595249, 3.058675062,
    1.450201253, 0.390600742, 0.012119854, 0.000132338, 3.25891984,
    2.364342323, 0.144497136, 0.843162564, 0.770066004, 10.507750454,
    2.35437128, 1, 3.701960013, 4.425697495, 2.716899247, 1.85298377,
    0.005729159, 0.125721411, 0.089801008, 0.219086164, 2.568237924,
    0.054330796, 0.597450037, 1.999999999, 2.601784687, 1.031812817,
    0.146383739), month_tot = c(58.999999982, 58.999999982, 58.999999982,
    58.999999982, 58.999999982, 58.999999982, 58.999999982, 58.999999982,
    58.999999982, 58.999999982, 58.999999982, 58.999999982, 58.999999982,
    58.999999982, 58.999999982, 58.999999982, 58.999999982, 58.999999982,
    27.000000001, 27.000000001, 27.000000001, 27.000000001, 27.000000001,
    27.000000001, 27.000000001, 27.000000001, 27.000000001, 27.000000001,
    27.000000001, 8.999999999, 8.999999999, 8.999999999, 8.999999999,
    8.999999999, 8.999999999, 8.999999999), prey_frq = c(29.1989395038234,
    30.6991688313997, 0.0686501356141645, 0.00858733559584021,
    9.36270136048353, 3.62201499093553, 6.20042535273911, 0.00439872711998605,
    5.1841950219206, 2.45796822617362, 0.66203515613418, 0.0205421254299959,
    0.000224301694983685, 5.52359295083771, 4.00735987071411,
    0.244910400074718, 1.42908909196142, 1.30519661734735, 38.9175942726327,
    8.71989362930667, 3.70370370356653, 13.7109630106033, 16.3914722030966,
    10.062589803331, 6.86290285159767, 0.0212191074066215, 0.46563485553831,
    0.332596325913608, 0.811430237006984, 28.535976936504, 0.603675511178186,
    6.63833374518204, 22.2222222135802, 28.9087187476565, 11.4645868568294,
    1.62648598906961), pos_label = c(85.4005302480883, 55.4514760804767,
    40.0675665969698, 40.0289478613648, 35.3433035133251, 28.8509453376155,
    23.9397251657782, 20.8373131258487, 18.2430162513284, 14.4219346272813,
    12.8619329361274, 12.5206442953453, 12.5102610817828, 9.74835245551644,
    4.98287604474054, 2.85674090934613, 2.01974116332806, 0.652598308673674,
    80.5412028636837, 56.722458912714, 50.5106602462774, 41.8033268891925,
    26.7521092823425, 13.5250782791287, 5.06233195166436, 1.6202709721622,
    1.37684399068974, 0.977728399963794, 0.405715118503494, 85.732011531748,
    71.1621853079069, 67.5411806797268, 53.1109027003457, 27.5454322197273,
    7.3587794174843, 0.813242994534804), Type = structure(c(1L,
    1L, 1L, 1L, 1L, 2L, 2L, 2L, 2L, 2L, 2L, 2L, 2L, 3L, 3L, 3L,
    3L, 3L, 1L, 1L, 1L, 2L, 2L, 2L, 2L, 2L, 2L, 3L, 3L, 1L, 1L,
    2L, 2L, 2L, 2L, 3L), levels = c("Pelagic", "Benthic", "Other"
    ), class = "factor")), row.names = c(NA, -36L), groups = structure(list(
    Season = structure(1:3, levels = c("Pre-Hypoxic", "Peak-Hypoxic",
    "Post-Hypoxic"), class = "factor"), .rows = structure(list(
        1:18, 19:29, 30:36), ptype = integer(0), class = c("vctrs_list_of",
    "vctrs_vctr", "list"))), class = c("tbl_df", "tbl", "data.frame" ), row.names = c(NA, -3L), .drop = TRUE), class = c("grouped_df",  "tbl_df", "tbl", "data.frame"))
还运行了这一行:
list <- c('Other' = 'none', 'Pelagic' = 'stripe', 'Benthic' = 'circle')我装载了下列软件包:
library(ggplot2)
library(tidyverse)
library(scales)
library("RColorBrewer")
library(data.table)
library(ggsci)
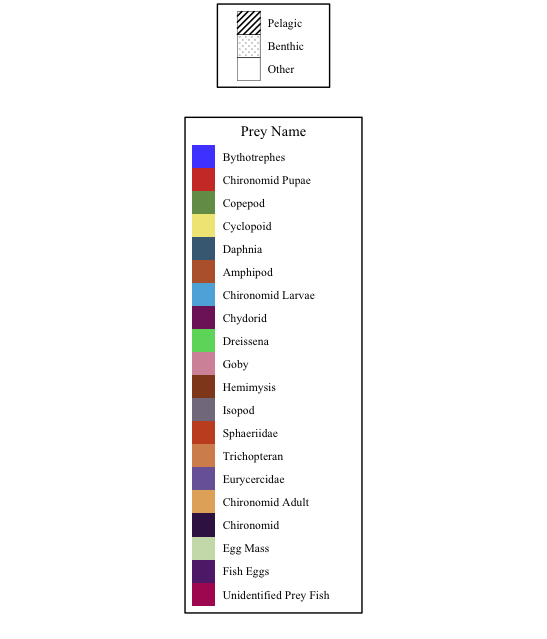
library(ggpattern)我考虑和排序的“类型”组,因为我想要传奇按以下顺序:中上层,底特式,其他。
具体来说,我想:
- 的图例更加清晰。例如,图例中的“中上层”组有更多的行(超过1行),而图例中的“底栖”组有更多的圆圈。
- 在图例模式项之外添加了一个大纲(框)(为线条设置一个框/大纲,一个用于圆圈,另一个用于空白(“其他”)组。
- 删除了该图例的标题"Type“,同时保留了另一个图例的标题”猎物名“。
- 并不十分重要,但是,是否可以移动模式图例,同时保持猎物名称图例的位置(例如,将图案移动到“顶部”位置)。或者,我可以将模式(“类型”)图例居中/对齐,使其(位于中间)位于猎物名称图例的中心吗?
我试着编辑这个传说已经有几天了,但是我尝试过的任何东西都没有奏效/改进过。
欢迎您对这个情节的美学提出任何其他建议!
谢谢!
回答 1
Stack Overflow用户
发布于 2022-10-27 01:42:39
有几件事:
face不是一个参数,但是fontface在geom_text(主题是face,尽管)中有scale_pattern_manual中的- ,您有
values = list,然后在这个函数中包含了列表(不是变量,而是内容)。你不需要两者兼得。一个或另一个就足够了。
我认为让这一切发生的最简单的方法是创建三个单独的情节。第一个只会有图案传说。第二只会有颜色传说。第三个人不会有传奇。最后,把碎片粉碎在一起。这就是它所创造的。
类型图例
我做了几处更改,以使type图例看起来像您所描述的那样。在ggplot中,我评论了对fill的调用。在geom_col_pattern (或bar + identity)中,我添加了fill和color,同时降低了缩放因子(因此您的图例中有许多条和点)。我还删除了对scale_fill_igv和guide的调用。最后,我将legend.margin和legend.title添加到对theme的调用中。(我认为这就是一切。)
这为您提供了一个模式更流行的图例,模式周围有方框,并给出了将其居中于其他图例的方法。这个情节中唯一重要的是传说。这是我们唯一能保留的部分。
# library(ggplot2) # redundant (this is in tidyverse)
# library(tidyverse) <--- moved last, so its functions have priority
library(scales)
library(RColorBrewer)
library(data.table)
library(ggsci)
library(ggpattern)
library(cowplot)    # get_legend(), plot_grid()
library(patchwork)  # blank plot: plot_spacer()
library(tidyverse)

#------------- for the pattern legend -------------
ggplot(try2, aes(Season, prey_frq, #fill = PreyName,
                 pattern = Type), fill = "white") +
  geom_col_pattern(fill = "white", color = "black",
                   pattern_color = "black", pattern_angle = 45,
                   pattern_density = 0.04, pattern_spacing = 0.04,
                   pattern_key_scale_factor = 0.3) +
  geom_text(data = subset(try2, prey_frq > 3),
            aes(y = pos_label, label = PreyName), fontface = "bold", size = 7) + # <---- error here; fixed face to fontface
  scale_pattern_manual(values = list, name = "") +
  ggtitle("TITLE") +
  labs(x="Season", fill = "Prey Name", y = "Prey Biomass Consumed (%)") +
  theme_bw() +
  theme(legend.position = "right",
        plot.title = element_text(hjust=0.5, face = "bold", family = "Arial", size=15),
        legend.background = element_rect(fill = "white", color = 1),
        # legend.title.align = 0.5,
        legend.margin = margin(t = .1, r = 15, b = 5, l = 15),
        legend.title = element_blank(),
        axis.title.y = element_text(size = 15, color = "black",
                                    margin = margin(t = 0, r = 10, b = 0, l = 0)),
        axis.title.x.top = element_text(size = 14, color = "black",
                                        margin = margin(t = 0, r = 0, b = 10, l = 0)),
        text = element_text(family = "Times New Roman"),
        axis.text.y = element_text(color = "black",
                                   size = 13, angle = 0, vjust = 0.5, hjust = 1,
                                   margin = margin(t = 0, r = 5, b = 0, l = 0)),
        axis.text.x = element_text(color = "black",
                                   size = 13, angle = 0, vjust = 1.5, hjust = 0.5,
                                   margin = margin(t = 5, r = 0, b = 0, l = 0)),
        axis.title.x = element_text(size = 14, face = "bold"),
        axis.ticks.x = element_blank(), plot.background = element_blank(),
        panel.grid.major = element_blank(), panel.grid.minor = element_blank(),
        axis.ticks.length = unit(0.2,"cm")) +
scale_y_continuous(expand = expansion(mult = c(0,0.01)))现在,摘取传说。如果你不马上打电话给它,last_plot()就不能工作了。(您只需将情节分配给对象,并在此处使用对象名称。)
types = get_legend(last_plot()) # extract the legend色彩传说
接下来是色彩传说。这里唯一真正的改变是移除模式传说。从最初的绘图开始(而不是其他图例的情节),我在pattern调用中注释掉了对ggplot的调用。我注释掉了对scale_pattern_manual的调用和在guides中对title的调用。
#------------ color legend ------------
ggplot(try2, aes(Season, prey_frq, fill = PreyName,
                 # pattern = Type
)) +
  geom_bar_pattern(stat = "identity", pattern_fill = "black",
                   pattern_color = "black", pattern_angle = 45,
                   pattern_density = 0.04, pattern_spacing = 0.04,
                   pattern_key_scale_factor = 0.6) +
  geom_text(data = subset(try2, prey_frq>3),
            aes(y = pos_label, label = PreyName),
            fontface = "bold", size = 4) +
  # scale_pattern_manual(values = list, name = "") +
  theme(legend.direction = "horizontal") +
  ggtitle("TITLE") +
  labs(x="Season", fill = "Prey Name", y = "Prey Biomass Consumed (%)") +
  scale_fill_igv(palette = "default") +
  guides(pattern = guide_legend(
    # title = "Type",
    title.position = "top", label.position = "right",
    label.hjust = 0.5, label.vjust = 1, override.aes = list(fill = "white"), order = 2),
    fill = guide_legend(override.aes = list(pattern = "none", order = 1))) +
  theme_bw() +
  theme(legend.position = "right",
        plot.title = element_text(hjust=0.5, face = "bold", family = "Arial", size=15),
        legend.background = element_rect(fill = "white", color = 1),
        legend.title.align = 0.5,
        axis.title.y = element_text(size = 15, color = "black",
                                    margin = margin(t = 0, r = 10, b = 0, l = 0)),
        axis.title.x.top = element_text(size = 14, color = "black",
                                        margin = margin(t = 0, r = 0, b = 10, l = 0)),
        text = element_text(family = "Times New Roman"),
        axis.text.y = element_text(color = "black",
                                   size = 13, angle = 0, vjust = 0.5, hjust = 1,
                                   margin = margin(t = 0, r = 5, b = 0, l = 0)),
        axis.text.x = element_text(color = "black",
                                   size = 13, angle = 0, vjust = 1.5, hjust = 0.5,
                                   margin = margin(t = 5, r = 0, b = 0, l = 0)),
        axis.title.x = element_text(size = 14, face = "bold"),
        axis.ticks.x = element_blank(), plot.background = element_blank(),
        panel.grid.major = element_blank(), panel.grid.minor = element_blank(),
        axis.ticks.length = unit(0.2,"cm")) +
  scale_y_continuous(expand = expansion(mult = c(0,0.01)))
这就是阴谋。
就像最后一个阴谋一样,你需要捕捉传说。
prey = get_legend(last_plot())接下来,我们将把传说合并成一个元素。这将很自然地把这两个人集中在一起。
(legs <- plot_grid(types, prey, plot_spacer() + theme_void(),
                   nrow = 2, ncol = 1, rel_heights = c(.1, .6)))
没有传说
现在,为你原来的情节。首先,你不想要任何传说。最简单的方法是将legend.position = "none"添加到对theme的调用中。所有其他与传说相关的东西都需要保持不变,所以情节呈现正确。
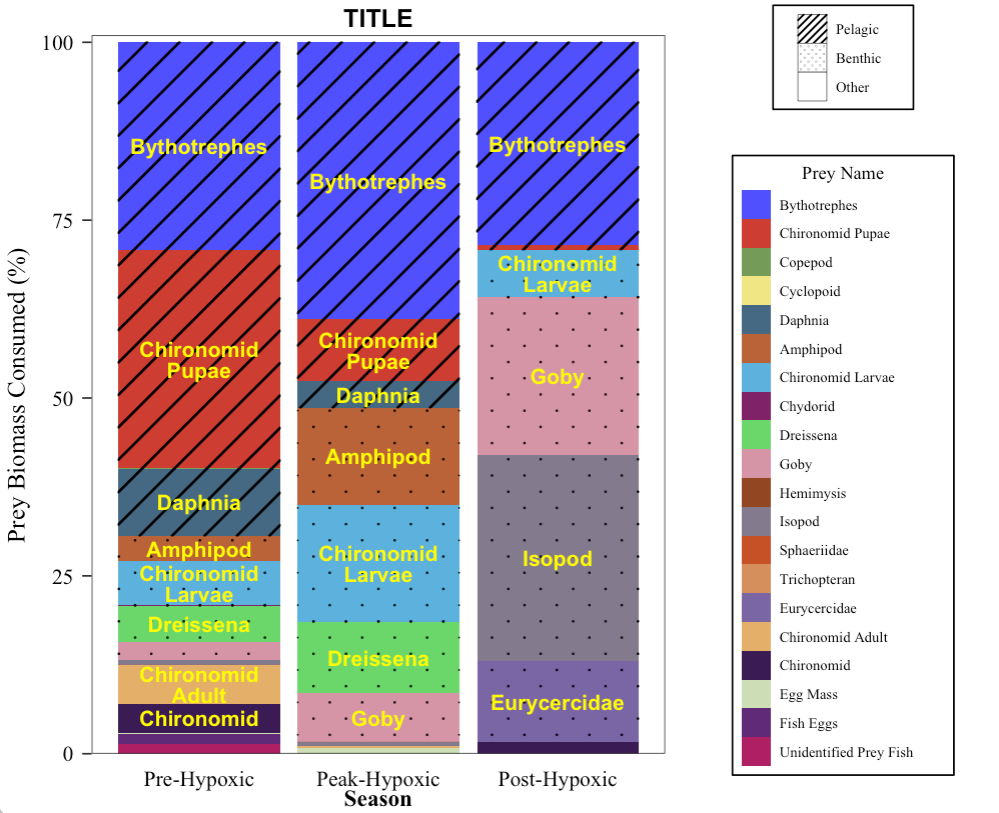
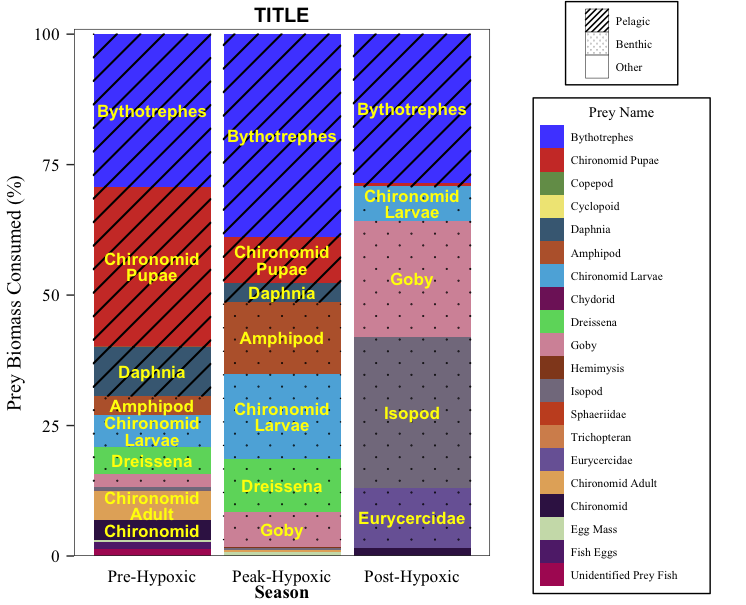
有几件事我冒昧地改变了。ggplot最大的问题之一是不相关的文本。您可以使用函数rel()来修复这个问题。此外,由于文本实际上是粗体的(它不在你的图片中),它就被吹灭了。我将str_wrap添加到geom_text中以包装文本。带着条纹,黑色的文字真的被吞没了,所以我试着用白色和其他浅色的颜色来看看什么起作用了。看起来yellow做得很好。(你可以随时改变它。)我使用参数lineheight将包装好的文本更紧密地放在一起。最后,我将此图分配给对象名为plt。
# ----------- final plot ----- NO LEGEND -------------
ggplot(try2, aes(Season, prey_frq, fill = PreyName, pattern = Type)) +
  geom_bar_pattern(stat = "identity", pattern_fill = "black",
                   pattern_color = "black", pattern_angle = 45,
                   pattern_density = 0.04, pattern_spacing = 0.04,
                   pattern_key_scale_factor = 0.6) +
  geom_text(data = subset(try2, prey_frq>3),
            aes(y = pos_label, label = str_wrap(PreyName, 10)),
            fontface = "bold", size = rel(4.5), color = "yellow",
            lineheight = .8) + # <---- error here; fixed face to fontface
  scale_pattern_manual(values = list, name = "") +
  theme(legend.direction = "horizontal") +
  ggtitle("TITLE") +
  labs(x="Season", fill = "Prey Name", y = "Prey Biomass Consumed (%)") +
  scale_fill_igv(palette = "default") +
  guides(pattern = guide_legend(
    # title = "Type",
    title.position = "top", label.position = "right",
    label.hjust = 0.5, label.vjust = 1, override.aes = list(fill = "white"), order = 2),
    fill = guide_legend(override.aes = list(pattern = "none", order = 1))) +
  theme_bw() +
  theme(legend.position = "none",
        plot.title = element_text(hjust=0.5, face = "bold", family = "Arial", size=15),
        # legend.background = element_rect(fill = "white", color = 1),
        # legend.title.align = 0.5,
        axis.title.y = element_text(size = 15, color = "black",
                                    margin = margin(t = 0, r = 10, b = 0, l = 0)),
        axis.title.x.top = element_text(size = 14, color = "black",
                                        margin = margin(t = 0, r = 0, b = 10, l = 0)),
        text = element_text(family = "Times New Roman"),
        axis.text.y = element_text(color = "black",
                                   size = 13, angle = 0, vjust = 0.5, hjust = 1,
                                   margin = margin(t = 0, r = 5, b = 0, l = 0)),
        axis.text.x = element_text(color = "black",
                                   size = 13, angle = 0, vjust = 1.5, hjust = 0.5,
                                   margin = margin(t = 5, r = 0, b = 0, l = 0)),
        axis.title.x = element_text(size = 14, face = "bold"),
        axis.ticks.x = element_blank(), plot.background = element_blank(),
        panel.grid.major = element_blank(), panel.grid.minor = element_blank(),
        axis.ticks.length = unit(0.2,"cm")) +
  scale_y_continuous(expand = expansion(mult = c(0,0.01))) -> plt
好的,再往前走一步。把所有的都放在一起。根据您将如何使用它和查看器窗格的大小,您可能需要调整rel_widths。
plot_grid(plt, legs, ncol = 2, rel_widths = c(.8, .4))
接下来,我将所有的代码放在一起,以便您更容易地收集它。(这都是上面看到的相同的代码。)
# library(ggplot2) # redundant
# library(tidyverse) <--- moved last, so it's functions have priority
library(scales)
library(RColorBrewer)
library(data.table)
library(ggsci)
library(ggpattern)
library(cowplot)    # get_legend(), plot_grid()
library(patchwork)  # blank plot: plot_spacer()
library(tidyverse)

#------------- for the pattern legend -------------
ggplot(try2, aes(Season, prey_frq, #fill = PreyName,
                 pattern = Type), fill = "white") +
  geom_col_pattern(fill = "white", color = "black",
                   pattern_color = "black", pattern_angle = 45,
                   pattern_density = 0.04, pattern_spacing = 0.04,
                   pattern_key_scale_factor = 0.3) +
  geom_text(data = subset(try2, prey_frq > 3),
            aes(y = pos_label, label = PreyName), fontface = "bold", size = 7) + # <---- error here; fixed face to fontface
  scale_pattern_manual(values = list, name = "") +
  ggtitle("TITLE") +
  labs(x="Season", fill = "Prey Name", y = "Prey Biomass Consumed (%)") +
  theme_bw() +
  theme(legend.position = "right",
        plot.title = element_text(hjust=0.5, face = "bold", family = "Arial", size=15),
        legend.background = element_rect(fill = "white", color = 1),
        # legend.title.align = 0.5,
        legend.margin = margin(t = .1, r = 15, b = 5, l = 15),
        legend.title = element_blank(),
        axis.title.y = element_text(size = 15, color = "black",
                                    margin = margin(t = 0, r = 10, b = 0, l = 0)),
        axis.title.x.top = element_text(size = 14, color = "black",
                                        margin = margin(t = 0, r = 0, b = 10, l = 0)),
        text = element_text(family = "Times New Roman"),
        axis.text.y = element_text(color = "black",
                                   size = 13, angle = 0, vjust = 0.5, hjust = 1,
                                   margin = margin(t = 0, r = 5, b = 0, l = 0)),
        axis.text.x = element_text(color = "black",
                                   size = 13, angle = 0, vjust = 1.5, hjust = 0.5,
                                   margin = margin(t = 5, r = 0, b = 0, l = 0)),
        axis.title.x = element_text(size = 14, face = "bold"),
        axis.ticks.x = element_blank(), plot.background = element_blank(),
        panel.grid.major = element_blank(), panel.grid.minor = element_blank(),
        axis.ticks.length = unit(0.2,"cm")) +
  scale_y_continuous(expand = expansion(mult = c(0,0.01)))

types = get_legend(last_plot())

#------------ color legend ------------
ggplot(try2, aes(Season, prey_frq, fill = PreyName,
                 # pattern = Type
)) +
  geom_bar_pattern(stat = "identity", pattern_fill = "black",
                   pattern_color = "black", pattern_angle = 45,
                   pattern_density = 0.04, pattern_spacing = 0.04,
                   pattern_key_scale_factor = 0.6) +
  geom_text(data = subset(try2, prey_frq>3),
            aes(y = pos_label, label = PreyName),
            fontface = "bold", size = 4) +
  # scale_pattern_manual(values = list, name = "") +
  theme(legend.direction = "horizontal") +
  ggtitle("TITLE") +
  labs(x="Season", fill = "Prey Name", y = "Prey Biomass Consumed (%)") +
  scale_fill_igv(palette = "default") +
  guides(pattern = guide_legend(
    # title = "Type",
    title.position = "top", label.position = "right",
    label.hjust = 0.5, label.vjust = 1, override.aes = list(fill = "white"), order = 2),
    fill = guide_legend(override.aes = list(pattern = "none", order = 1))) +
  theme_bw() +
  theme(legend.position = "right",
        plot.title = element_text(hjust=0.5, face = "bold", family = "Arial", size=15),
        legend.background = element_rect(fill = "white", color = 1),
        legend.title.align = 0.5,
        axis.title.y = element_text(size = 15, color = "black",
                                    margin = margin(t = 0, r = 10, b = 0, l = 0)),
        axis.title.x.top = element_text(size = 14, color = "black",
                                        margin = margin(t = 0, r = 0, b = 10, l = 0)),
        text = element_text(family = "Times New Roman"),
        axis.text.y = element_text(color = "black",
                                   size = 13, angle = 0, vjust = 0.5, hjust = 1,
                                   margin = margin(t = 0, r = 5, b = 0, l = 0)),
        axis.text.x = element_text(color = "black",
                                   size = 13, angle = 0, vjust = 1.5, hjust = 0.5,
                                   margin = margin(t = 5, r = 0, b = 0, l = 0)),
        axis.title.x = element_text(size = 14, face = "bold"),
        axis.ticks.x = element_blank(), plot.background = element_blank(),
        panel.grid.major = element_blank(), panel.grid.minor = element_blank(),
        axis.ticks.length = unit(0.2,"cm")) +
  scale_y_continuous(expand = expansion(mult = c(0,0.01)))

prey = get_legend(last_plot())

(legs <- plot_grid(types, prey, plot_spacer() + theme_void(),
                   nrow = 2, ncol = 1, rel_heights = c(.1, .6)))


# ----------- final plot ----- NO LEGEND -------------
ggplot(try2, aes(Season, prey_frq, fill = PreyName, pattern = Type)) +
  geom_bar_pattern(stat = "identity", pattern_fill = "black",
                   pattern_color = "black", pattern_angle = 45,
                   pattern_density = 0.04, pattern_spacing = 0.04,
                   pattern_key_scale_factor = 0.6) +
  geom_text(data = subset(try2, prey_frq>3),
            aes(y = pos_label, label = str_wrap(PreyName, 10)),
            fontface = "bold", size = rel(4.5), color = "yellow",
            lineheight = .8) + # <---- error here; fixed face to fontface
  scale_pattern_manual(values = list, name = "") +
  theme(legend.direction = "horizontal") +
  ggtitle("TITLE") +
  labs(x="Season", fill = "Prey Name", y = "Prey Biomass Consumed (%)") +
  scale_fill_igv(palette = "default") +
  guides(pattern = guide_legend(
    # title = "Type",
    title.position = "top", label.position = "right",
    label.hjust = 0.5, label.vjust = 1, override.aes = list(fill = "white"), order = 2),
    fill = guide_legend(override.aes = list(pattern = "none", order = 1))) +
  theme_bw() +
  theme(legend.position = "none",
        plot.title = element_text(hjust=0.5, face = "bold", family = "Arial", size=15),
        # legend.background = element_rect(fill = "white", color = 1),
        # legend.title.align = 0.5,
        axis.title.y = element_text(size = 15, color = "black",
                                    margin = margin(t = 0, r = 10, b = 0, l = 0)),
        axis.title.x.top = element_text(size = 14, color = "black",
                                        margin = margin(t = 0, r = 0, b = 10, l = 0)),
        text = element_text(family = "Times New Roman"),
        axis.text.y = element_text(color = "black",
                                   size = 13, angle = 0, vjust = 0.5, hjust = 1,
                                   margin = margin(t = 0, r = 5, b = 0, l = 0)),
        axis.text.x = element_text(color = "black",
                                   size = 13, angle = 0, vjust = 1.5, hjust = 0.5,
                                   margin = margin(t = 5, r = 0, b = 0, l = 0)),
        axis.title.x = element_text(size = 14, face = "bold"),
        axis.ticks.x = element_blank(), plot.background = element_blank(),
        panel.grid.major = element_blank(), panel.grid.minor = element_blank(),
        axis.ticks.length = unit(0.2,"cm")) +
  scale_y_continuous(expand = expansion(mult = c(0,0.01))) -> plt

plot_grid(plt, legs, ncol = 2, rel_widths = c(.8, .4))https://stackoverflow.com/questions/74215107
复制相似问题
腾讯云开发者

Copyright © 2013 - 2026 Tencent Cloud. All Rights Reserved. 腾讯云 版权所有
深圳市腾讯计算机系统有限公司 ICP备案/许可证号:粤B2-20090059 ![]() 粤公网安备44030502008569号
粤公网安备44030502008569号
腾讯云计算(北京)有限责任公司 京ICP证150476号 | 京ICP备11018762号