
增加背景透明度和自定义顺序在图片中,在in图中
增加背景透明度和自定义顺序在图片中,在in图中
提问于 2022-10-26 17:34:38
假设我有低于ggplot的
library(ggplot2)
library(ggnewscale)
data =
structure(list(grp1 = c("X", "X", "X", "X", "Y", "Y", "Y", "Y"
), grp2 = c("A", "B", "C", "D", "A", "B", "C", "D"), val = c(1,
2, 3, 4, 3, 4, 5, 6)), row.names = c(NA, -8L), class = "data.frame")
col_define = c('red', 'orange', 'blue', 'lightblue')
names(col_define) = c('A', 'B', 'C', 'D')
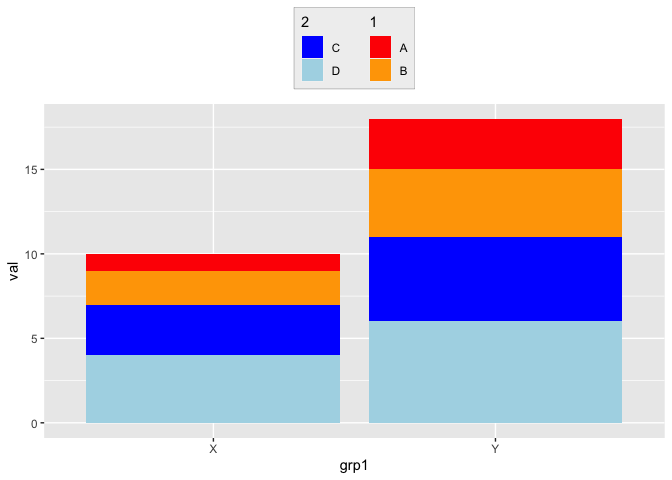
ggplot(data, aes(x = grp1, group = grp2, y = val)) +
geom_col(aes(fill = grp2)) +
scale_fill_manual(values = col_define, breaks = c("A", "B"), name = "1") +
new_scale_fill() +
geom_col(aes(fill = grp2)) +
scale_fill_manual(values = col_define, breaks = c("C", "D"), name = "2") +
theme(legend.position="top", legend.direction = 'vertical',
legend.box.margin = margin(),
legend.box.background = element_rect(fill = alpha('#e5e5e5', 0.60), size = 0.1, linetype = 'solid', color = '#333333'))正如我们所看到的,我试图使用element_rect(fill = alpha('#e5e5e5', 0.60)在我的绘图中添加背景透明性,但是不起作用。有没有其他方法在这个情节的背景中增加透明度?
我还想更改像2, 1这样的图例标签中的顺序,而不是1, 2。基本上,我想应用一些定制的订购,以防有很多级别。
任何指针都会非常有用。
回答 2
Stack Overflow用户
回答已采纳
发布于 2022-10-26 17:48:55
传奇背景总是有点棘手。因为我们必须处理多个因素。另外,我也不能百分之百肯定你所说的增加背景透明度是什么意思。但我做的第一件事是删除legend.background的颜色和填充,即围绕每个图例绘制的框(而legend.box.background是围绕所有传说绘制的框的背景)( BTW:还有通过legend.key设置的单个图例键的背景。D )。
简单的部分是故事的顺序,可以通过order参数guide_legend来设定。
library(ggplot2)
library(ggnewscale)

data <-
  structure(list(grp1 = c("X", "X", "X", "X", "Y", "Y", "Y", "Y"), grp2 = c("A", "B", "C", "D", "A", "B", "C", "D"), val = c(
    1,
    2, 3, 4, 3, 4, 5, 6
  )), row.names = c(NA, -8L), class = "data.frame")

col_define <- c("red", "orange", "blue", "lightblue")
names(col_define) <- c("A", "B", "C", "D")

ggplot(data, aes(x = grp1, group = grp2, y = val)) +
  geom_col(aes(fill = grp2)) +
  scale_fill_manual(values = col_define, breaks = c("A", "B"), name = "1", guide = guide_legend(order = 2)) +
  new_scale_fill() +
  geom_col(aes(fill = grp2)) +
  scale_fill_manual(values = col_define, breaks = c("C", "D"), name = "2", guide = guide_legend(order = 1)) +
  theme(
    legend.position = "top",
    legend.direction = "vertical",
    legend.box.margin = margin(),
    legend.background = element_rect(color = NA, fill = NA),
    legend.box.background = element_rect(
      fill = alpha('#e5e5e5', .6), size = 0.1, linetype = "solid", color = "#333333"
    )
  )
Stack Overflow用户
发布于 2022-10-26 18:13:58
以下是另一种选择:
ggplot(data, aes(x = grp1, group = grp2, y = val)) +
  geom_col(aes(fill = grp2)) +
  scale_fill_manual(values = col_define, breaks = c("B", "A"), name = "1") +
  new_scale_fill() +
  geom_col(aes(fill = grp2)) +
  scale_fill_manual(values = col_define, breaks = c("C", "D"), name = "2") +
  theme(legend.position="top", legend.direction = 'vertical',
        legend.background = element_rect(fill="gray",
                                         size=1, linetype="solid",
                                         color ="gray"))

页面原文内容由Stack Overflow提供。腾讯云小微IT领域专用引擎提供翻译支持
原文链接:
https://stackoverflow.com/questions/74211948
复制相关文章
相似问题
腾讯云开发者

Copyright © 2013 - 2026 Tencent Cloud. All Rights Reserved. 腾讯云 版权所有
深圳市腾讯计算机系统有限公司 ICP备案/许可证号:粤B2-20090059 ![]() 粤公网安备44030502008569号
粤公网安备44030502008569号
腾讯云计算(北京)有限责任公司 京ICP证150476号 | 京ICP备11018762号