
图例定位
图例定位
提问于 2022-10-25 18:46:18
这是我的数据和相应的ggplot
library(ggplot2)
library(ggnewscale)
library(cowplot)
library(ggalluvial)
library(patchwork)

data =
structure(list(grp1 = c("X", "X", "X", "X", "Y", "Y", "Y", "Y"
), grp2 = c("A", "B", "C", "D", "A", "B", "C", "D"), val = c(1,
2, 3, 4, 3, 4, 5, 6)), row.names = c(NA, -8L), class = "data.frame")

col_define = c('red', 'orange', 'blue', 'lightblue')
names(col_define) = c('A', 'B', 'C', 'D')

p <- ggplot(data, aes(x = grp1, group = grp2, y = val)) +
  geom_col(aes(fill = grp2)) +
  scale_fill_manual(values = col_define, breaks = c("A", "B"), name = "1") +
  new_scale_fill() +
  geom_col(aes(fill = grp2)) +
  scale_fill_manual(values = col_define, breaks = c("C", "D"), name = "2") +
  #guides(fill=guide_legend(order = 1, ncol = 2)) +
  theme(legend.position="top", legend.direction = 'vertical')

p_legend <- cowplot::get_legend(p)

ggplot(data,
       aes(x = grp1, stratum = grp2, alluvium = grp2,
           y = val,
           fill = grp2)) +
  geom_flow(aes(fill = grp2), alpha = .3) +
  geom_stratum(aes(color = grp2), alpha = .9) +
  scale_fill_manual(values = col_define, breaks = names(col_define), aesthetics = c("color", "fill")) +
  guides(color = "none", fill = "none") +
  p_legend +
  theme(legend.position="top") +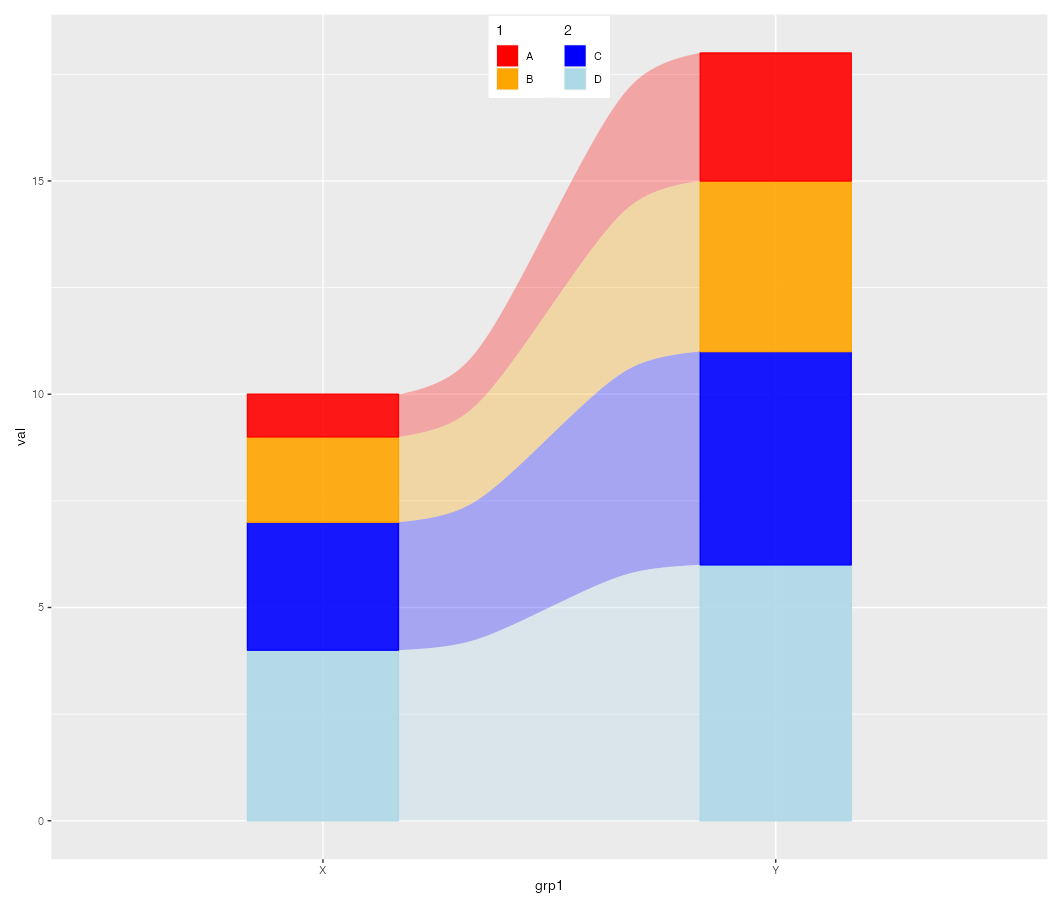
plot_layout(widths = c(50, 1))我想把最后一个情节的传说放在地块窗口的顶部中心位置(即浅灰色区域)。我尝试了不同的输入,例如theme(legend.position="top"),但是这似乎不起作用。
是否有任何方法将图例位置固定在上面的情节窗口内的顶部中心位置?
注:
这个情节是根据我先前的文章中被接受的答案
回答 1
Stack Overflow用户
回答已采纳
发布于 2022-10-25 19:15:44
将图例添加到绘图面板中的一个选项是使用patchwork::inset_element。
注1:我删除了legend.box.margin,并将legend.box.background填充设置为“白色”,但可以根据您的喜好随意调整。
注2:我在cowplot::ggdraw中包装了图例图,以删除图例周围的白色边距。
p <- ggplot(data, aes(x = grp1, group = grp2, y = val)) +
  geom_col(aes(fill = grp2)) +
  scale_fill_manual(values = col_define, breaks = c("A", "B"), name = "1") +
  new_scale_fill() +
  geom_col(aes(fill = grp2)) +
  scale_fill_manual(values = col_define, breaks = c("C", "D"), name = "2") +
  theme(legend.position="top", legend.direction = 'vertical',
        legend.box.margin = margin(),
        legend.box.background = element_rect(fill = "white", color = NA))

p_legend <- cowplot::get_legend(p)

p_main <- ggplot(data, aes(x = grp1, stratum = grp2, alluvium = grp2,
           y = val,
           fill = grp2)) +
  geom_flow(aes(fill = grp2), alpha = .3) +
  geom_stratum(aes(color = grp2), alpha = .9) +
  scale_fill_manual(values = col_define, breaks = names(col_define), aesthetics = c("color", "fill")) +
  guides(color = "none", fill = "none")

p_main +
  inset_element(ggdraw(p_legend), right = .6, top = 1, left = .4, bottom = .9, clip = TRUE)
页面原文内容由Stack Overflow提供。腾讯云小微IT领域专用引擎提供翻译支持
原文链接:
https://stackoverflow.com/questions/74198807
复制相关文章
相似问题
腾讯云开发者

Copyright © 2013 - 2026 Tencent Cloud. All Rights Reserved. 腾讯云 版权所有
深圳市腾讯计算机系统有限公司 ICP备案/许可证号:粤B2-20090059 ![]() 粤公网安备44030502008569号
粤公网安备44030502008569号
腾讯云计算(北京)有限责任公司 京ICP证150476号 | 京ICP备11018762号