
使用matplotlib动画而不是一个动画获得两个图
使用matplotlib动画而不是一个动画获得两个图
提问于 2022-10-25 15:33:37
我试图用地质公园和资料库绘制世界人口图。我还使用matplotlib动画为每年的图形动画。
import matplotlib.ticker as ticker
import matplotlib.animation as animation
from IPython.display import HTML


fig,ax=plt.subplots(1,1,figsize=(15,5))

def animation_bar(year):
    filtered=df[df['Year']==year]
    filtered.plot(ax=ax,column='Population',cmap='Reds',scheme='quantiles')
    ax.set_title(int(year),fontweight='bold')

animator=animation.FuncAnimation(fig,animation_bar,frames=sorted(df['Year'].unique()),interval=300)
HTML(animator.to_jshtml())
我得到两个图作为输出:
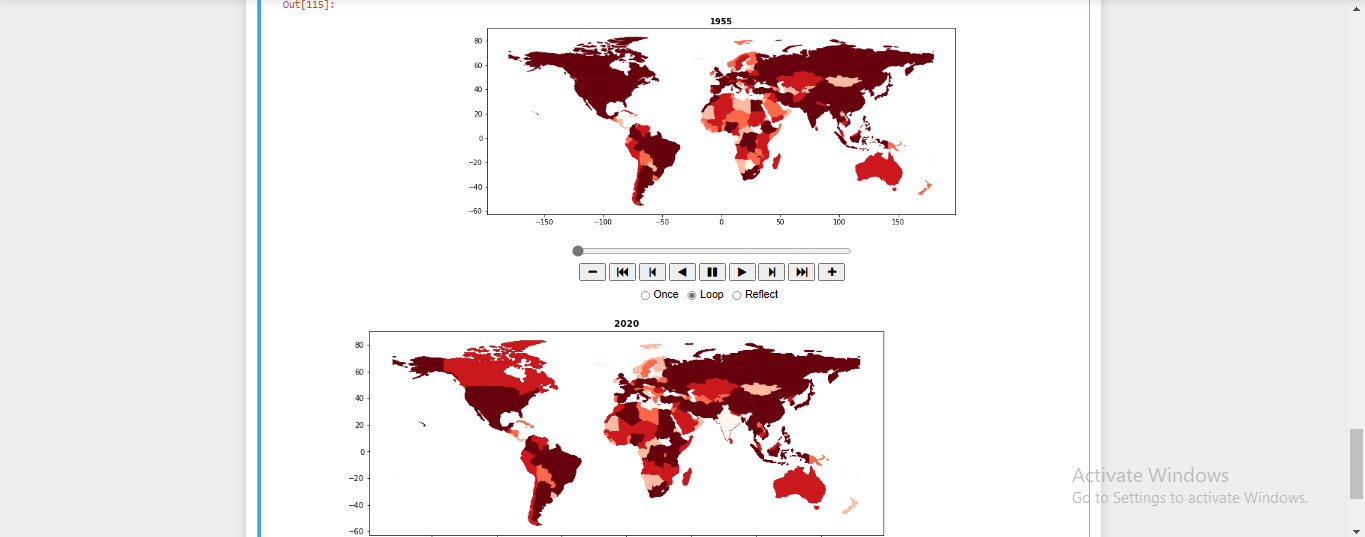
一个图是按预期绘制的,第二个是静态的。关于输出的另一个关注点是,图更小。如代码所示,我想要figsize=(15,5)。它应该比现在更大。我不能增加它的尺寸。
如何修改代码?
回答 1
Stack Overflow用户
发布于 2022-10-26 23:45:36
您可以在plt.subplots和HTML(animator.to_jshtml())之间的任何地方使用HTML(animator.to_jshtml())。
例如:
import matplotlib.pyplot as plt
import matplotlib.animation
from IPython.display import HTML

fig, ax = plt.subplots()
l = ax.plot([0, 2], [0, 3])[0]
t = [0, 1, 2]
x = [2, 0, 3]
animate = lambda n: l.set_data(t[:n+2], x[:n+2])
ani = matplotlib.animation.FuncAnimation(fig, animate, frames=2)

plt.close()  # here it is!
HTML(ani.to_jshtml())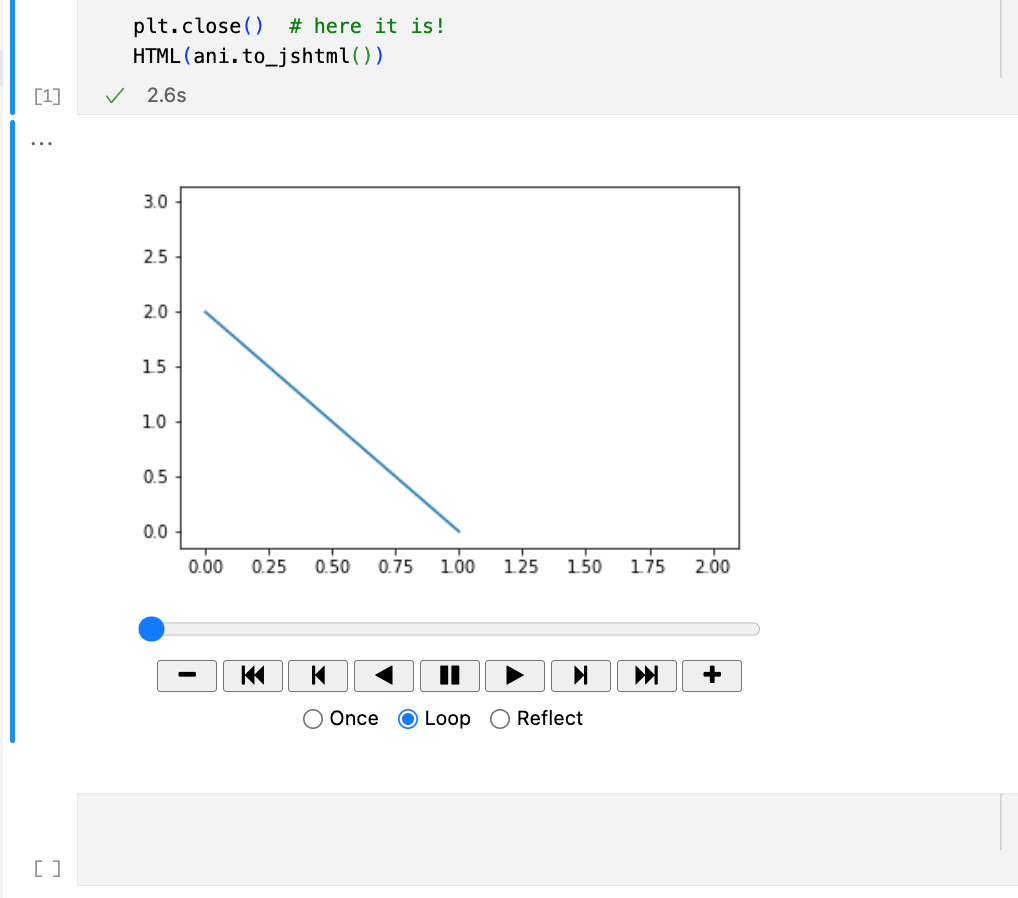
页面原文内容由Stack Overflow提供。腾讯云小微IT领域专用引擎提供翻译支持
原文链接:
https://stackoverflow.com/questions/74196620
复制相关文章
相似问题
腾讯云开发者

Copyright © 2013 - 2026 Tencent Cloud. All Rights Reserved. 腾讯云 版权所有
深圳市腾讯计算机系统有限公司 ICP备案/许可证号:粤B2-20090059  粤公网安备44030502008569号
腾讯云计算(北京)有限责任公司 京ICP证150476号 | 京ICP备11018762号