
如何在使用bsButton时切换带有图标的shinyBS?
如何在使用bsButton时切换带有图标的shinyBS?
提问于 2022-10-25 08:42:39
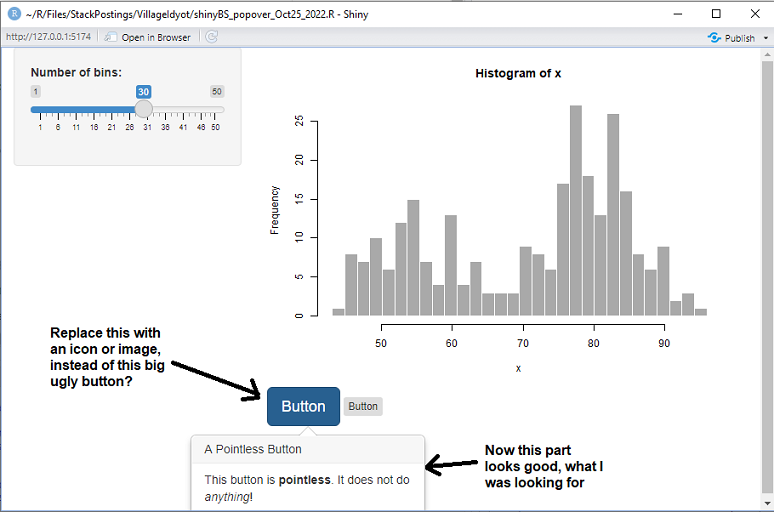
我正在寻找悬停(“弹出”)用户说明时,光标被放置在一个图标。没有模态,只是一个悬停弹出。我用过工具提示之类的东西,但是文字太小了,无法格式化。包shinyBS可能提供一个很好的解决方案。但是,在下面摘自shinyBS文档的示例代码中,我想将shinyBS bsButton()替换为图标(小的"i")或图像( "?“)。)而不是下面的图片中显示的大而笨重的按钮。对如何做到这一点有什么建议吗?
代码:
# Source: shinyBS package documentation, pg 24-25

library(shiny)
library(shinyBS)

app = shinyApp(
  ui =
    fluidPage(
      sidebarLayout(
        sidebarPanel(
          sliderInput("bins",
                      "Number of bins:",
                      min = 1,
                      max = 50,
                      value = 30),
          bsTooltip("bins", "The wait times will be broken into this many equally spaced bins",
                    "right", options = list(container = "body"))
        ),
        mainPanel(
          plotOutput("distPlot"),
          uiOutput("uiExample")
        )
      )
    ),
  server =
    function(input, output, session) {
      output$distPlot <- renderPlot({
        x <- faithful[, 2]
        bins <- seq(min(x), max(x), length.out = input$bins + 1)
        hist(x, breaks = bins, col = 'darkgray', border = 'white')
      })
      output$uiExample <- renderUI({
        tags$span(
          popify(bsButton("pointlessButton", "Button", style = "primary", size = "large"),
                 "A Pointless Button",
                 "This button is <b>pointless</b>. It does not do <em>anything</em>!"),
          tipify(bsButton("pB2", "Button", style = "inverse", size = "extra-small"),
                 "This button is pointless too!")
        )
      })
      addPopover(session, "distPlot", "Data", content = paste0("<p>Waiting time between ",
                                                               "eruptions and the duration of the eruption for the Old Faithful geyser ",
                                                               "in Yellowstone National Park, Wyoming, USA.</p><p>Azzalini, A. and ",
                                                               "Bowman, A. W. (1990). A look at some data on the Old Faithful geyser. ",
                                                               "Applied Statistics 39, 357-365.</p>"), trigger = 'click')
    }
)

runApp(app)回答 1
Stack Overflow用户
回答已采纳
发布于 2022-10-25 10:35:02
我重做了这个例子,尽管Stéphane Laurent已经回答了。
library(shiny)
library(shinyBS)

app = shinyApp(
    ui =
        fluidPage(
            sidebarLayout(
                sidebarPanel(
                    sliderInput("bins",
                                "Number of bins:",
                                min = 1,
                                max = 50,
                                value = 30),
                    bsTooltip("bins", "The wait times will be broken into this many equally spaced bins",
                              "right", options = list(container = "body"))
                ),
                mainPanel(
                    plotOutput("distPlot"),
                    uiOutput("uiExample")
                )
            )
        ),
    server =
        function(input, output, session) {
            output$distPlot <- renderPlot({
                x <- faithful[, 2]
                bins <- seq(min(x), max(x), length.out = input$bins + 1)
                hist(x, breaks = bins, col = 'darkgray', border = 'white')
            })
            output$uiExample <- renderUI({
                tags$span(
                    popify(icon("info-circle", verify_fa = FALSE),
                           "A Pointless Icon",
                           "This icon is <b>pointless</b>. It does not do <em>anything</em>!"),
                    tipify(img(src = 'https://upload.wikimedia.org/wikipedia/commons/1/11/Blue_question_mark_icon.svg', width = '50px'),
                           "This image is pointless too!")
                )
            })
            addPopover(session, "distPlot", "Data", content = paste0("<p>Waiting time between ",
                                                                     "eruptions and the duration of the eruption for the Old Faithful geyser ",
                                                                     "in Yellowstone National Park, Wyoming, USA.</p><p>Azzalini, A. and ",
                                                                     "Bowman, A. W. (1990). A look at some data on the Old Faithful geyser. ",
                                                                     "Applied Statistics 39, 357-365.</p>"), trigger = 'click')
        }
)

runApp(app)页面原文内容由Stack Overflow提供。腾讯云小微IT领域专用引擎提供翻译支持
原文链接:
https://stackoverflow.com/questions/74191341
复制相关文章
相似问题
腾讯云开发者

Copyright © 2013 - 2026 Tencent Cloud. All Rights Reserved. 腾讯云 版权所有
深圳市腾讯计算机系统有限公司 ICP备案/许可证号:粤B2-20090059 ![]() 粤公网安备44030502008569号
粤公网安备44030502008569号
腾讯云计算(北京)有限责任公司 京ICP证150476号 | 京ICP备11018762号