
堆叠条形图的of图分组图例
假设我在ggplot下面画一个stacked bar chart
library(ggplot2)

col_define = c('red', 'orange', 'blue', 'lightblue')
names(col_define) = c('A', 'B', 'C', 'D')
data = rbind(data.frame('grp1' = 'X', 'grp2' = c('A', 'B', 'C', 'D'), 'val' = c(1,2,3,4)), data.frame('grp1' = 'Y', 'grp2' = c('A', 'B', 'C', 'D'), 'val' = c(1,2,3,4)+2))
ggplot(data, aes(x = grp1, fill = grp2, y = val)) +
    geom_bar(stat = 'identity', position = 'stack') +
    scale_fill_manual(aesthetics = "fill", values = col_define,
breaks = names(col_define))它把所有的颜色都放在一个传说里。然而,在我的例子中,我基本上有两个颜色组,一个用于A & B,第二个用于C & D。
我在ggplot2: Divide Legend into Two Columns, Each with Its Own Title中进行了类似的讨论,其中有一种使用包ggnewscale或relayer来组合图例颜色的方法。
但是,这种方法只能在ordinary bar chart中应用,在那里可以多次调用geom_bar。
相反,在我的例子中,geom_bar不能多次被调用,因为它是一个整体对象
我正在寻找一些方法使用ggnewscale或relayer包在我的stack bar chart组合颜色在传奇。
正如@stefan在其中一个答案中所建议的,这是使用geom_col的一种可能的方式。
然而,我发现这种方法是相当限制性的,因为我不能将此方法应用于alluvial绘图,其数据如下所示
library(ggalluvial)
ggplot(data,
       aes(x = grp1, stratum = grp2, alluvium = grp2,
           y = val,
           fill = grp2)) +
  geom_flow(aes(fill = grp2), alpha = .3) +
  geom_stratum(aes(color = grp2), alpha = .9) +
  scale_fill_manual(values = col_define, breaks = names(col_define))
在传说中,是否有一种更普遍的方法来处理群体色彩?
回答 1
Stack Overflow用户
发布于 2022-10-25 07:07:16
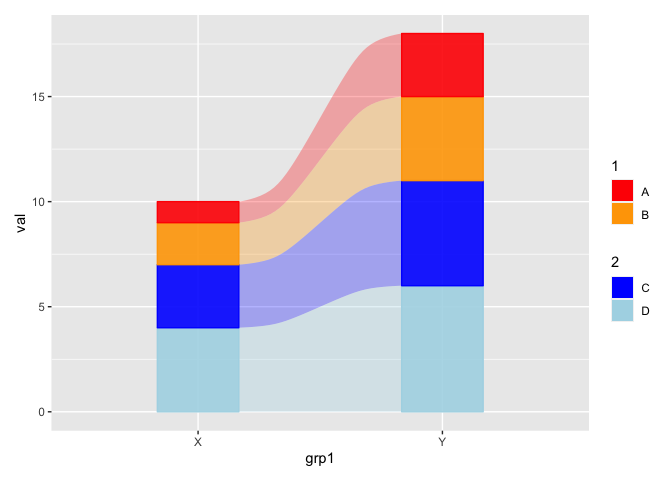
由于所提供的补充资料要求提出不同的问题,国际水文学组织的第二个答案是适当的。基本上,它建立在我的第一个答案的基础上,因为我使用ggnewscale为条形图创建了一个分组图例。在第二步中,我通过cowplot::get_legend提取这个图例,通过patchwork将其添加到冲积图中。再一次,这并不优雅,但IMHO是实现预期结果的最简单方法:
注意:我试过使用“ggnew比例尺withggalluvial`”,但后者似乎很特殊,而且有点固执。(这就是为什么我换了另一种方法。
library(ggplot2)
library(ggnewscale)
library(cowplot)
library(ggalluvial)
library(patchwork)

# Create a grouped legend
p <- ggplot(data, aes(x = grp1, group = grp2, y = val)) +
  geom_col(aes(fill = grp2)) +
  scale_fill_manual(values = col_define, breaks = c("A", "B"), name = "1") +
  new_scale_fill() +
  geom_col(aes(fill = grp2)) +
  scale_fill_manual(values = col_define, breaks = c("C", "D"), name = "2")

p_legend <- cowplot::get_legend(p)

# Alluvial plot without legend
p_alluvial <- ggplot(data,
       aes(x = grp1, stratum = grp2, alluvium = grp2,
           y = val,
           fill = grp2)) +
  geom_flow(aes(fill = grp2), alpha = .3) +
  geom_stratum(aes(color = grp2), alpha = .9) +
  scale_fill_manual(values = col_define, breaks = names(col_define), aesthetics = c("color", "fill")) +
  guides(color = "none", fill = "none")

# Alluvial plot with legend via patchwork
p_alluvial + p_legend + plot_layout(widths = c(10, 1))
#> Warning: `spread_()` was deprecated in tidyr 1.2.0.
#> ℹ Please use `spread()` instead.
#> ℹ The deprecated feature was likely used in the ggalluvial package.
#>   Please report the issue at
#>   <https://github.com/corybrunson/ggalluvial/issues>.
#> Warning: The `.dots` argument of `group_by()` is deprecated as of dplyr 1.0.0.
#> ℹ The deprecated feature was likely used in the dplyr package.
#>   Please report the issue at <https://github.com/tidyverse/dplyr/issues>.
https://stackoverflow.com/questions/74187533
复制相似问题
腾讯云开发者

Copyright © 2013 - 2026 Tencent Cloud. All Rights Reserved. 腾讯云 版权所有
深圳市腾讯计算机系统有限公司 ICP备案/许可证号:粤B2-20090059 ![]() 粤公网安备44030502008569号
粤公网安备44030502008569号
腾讯云计算(北京)有限责任公司 京ICP证150476号 | 京ICP备11018762号