
使用DataGrip,是否有一种方法可以在不直接选择/爆炸每个结构和数组的情况下隐式地显示结构和数组的每个元素?
使用DataGrip,是否有一种方法可以在不直接选择/爆炸每个结构和数组的情况下隐式地显示结构和数组的每个元素?
提问于 2022-10-24 22:27:53
我正在使用JetBrains‘DataGrip查询Google的DataGrip数据库。我在很多方面都喜欢UI,但我想知道的是,是否有一种更友好的方式来查看结构和数组。我讨厌BigQuery WebUI有很多原因,但我喜欢它们隐式地呈现结构和数组的方式。
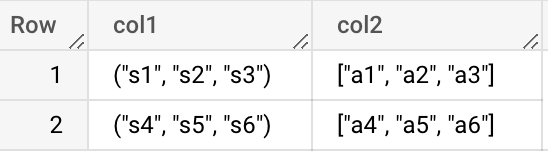
select struct("s1","s2","s3")
     , array(select "a1" union all select "a2" union all select "a3")
 union all
select struct("s4","s5","s6")
     , array(select "a4" union all select "a5" union all select "a6")
为了澄清图像,我喜欢BigQuery中的以下内容:
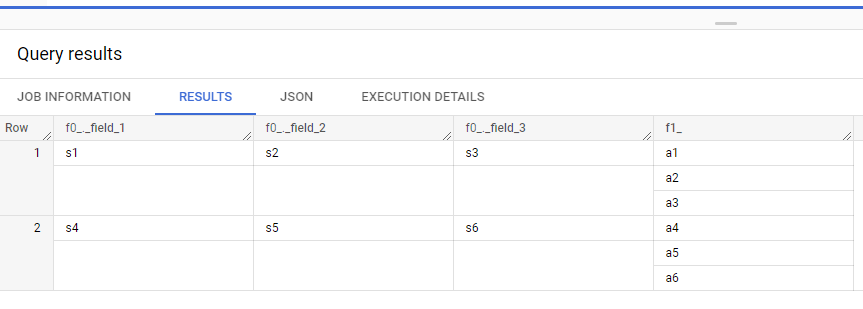
DataGrip更难读懂:
回答 2
Stack Overflow用户
回答已采纳
发布于 2022-10-25 12:17:30
Stack Overflow用户
发布于 2022-10-25 00:53:47
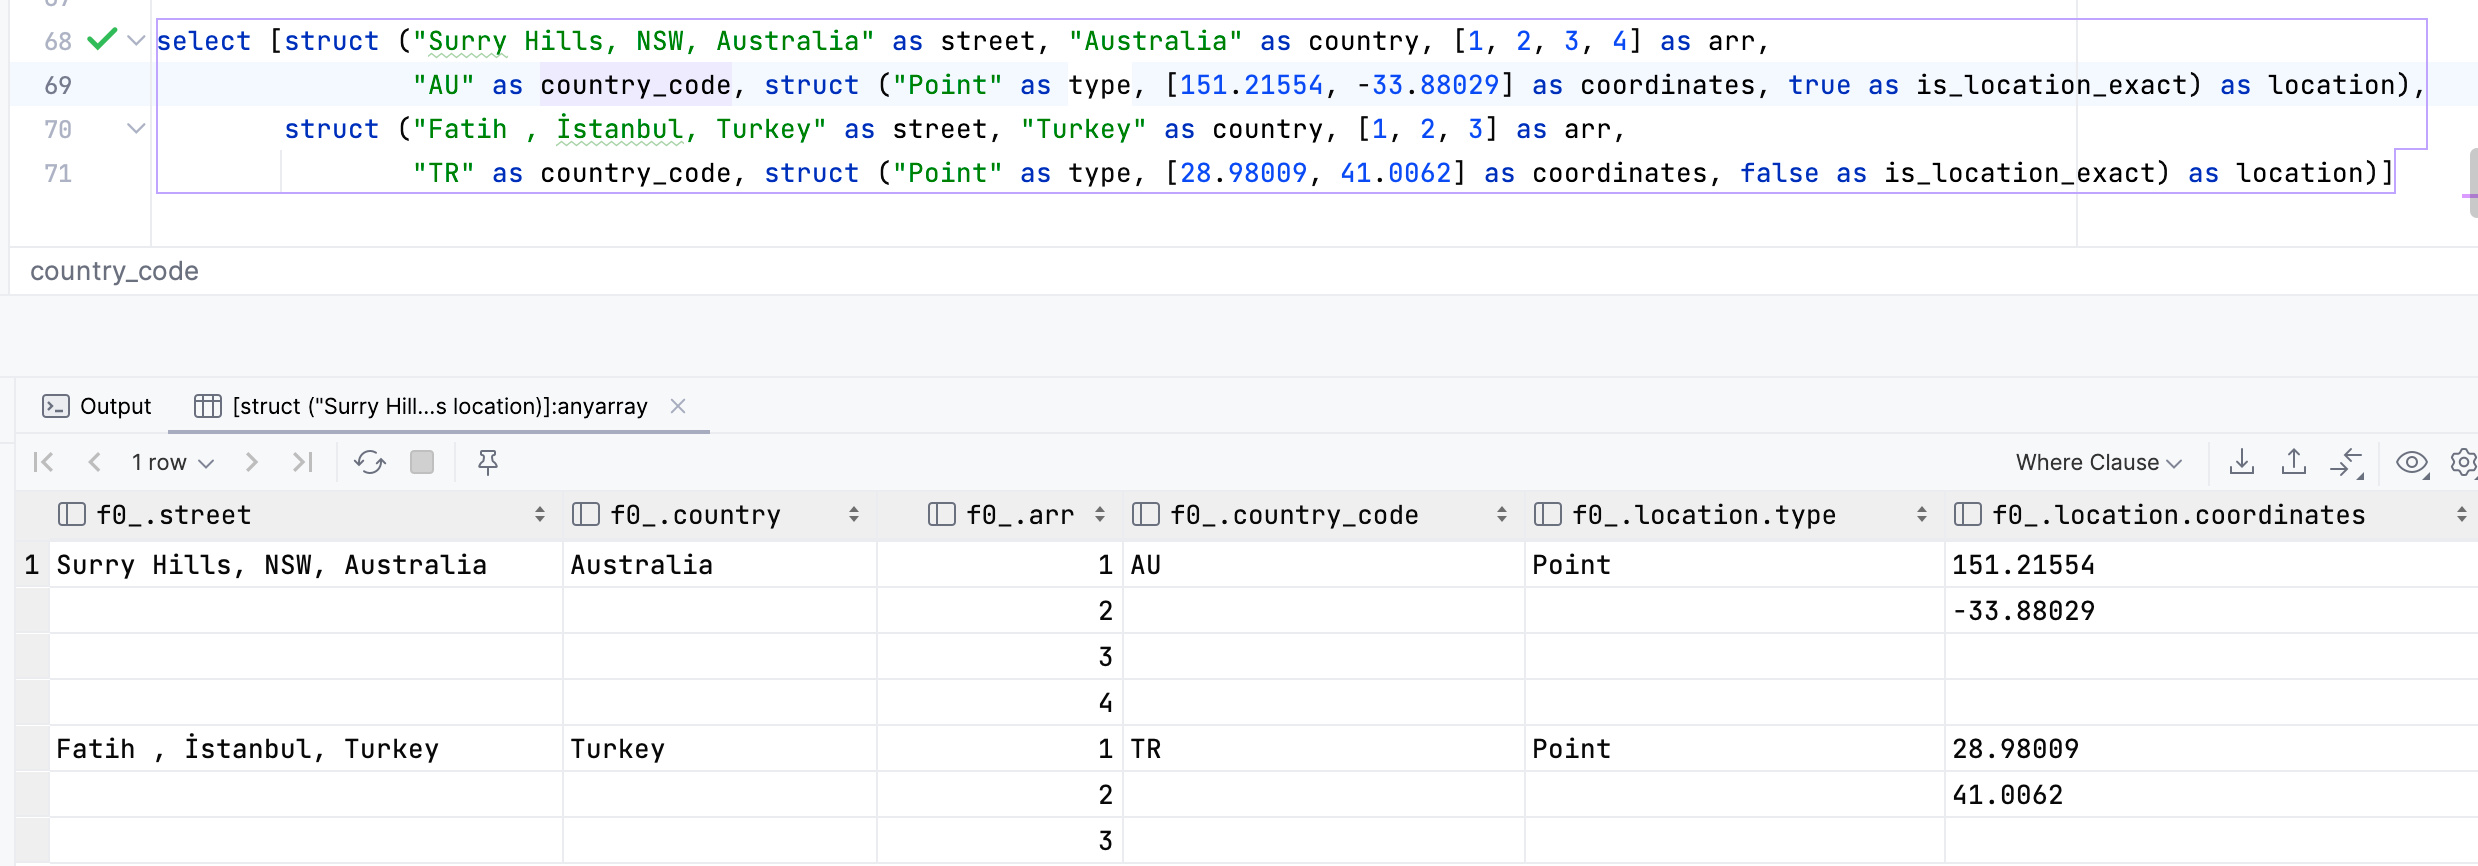
不确定它在DataGrip中会是什么样子,但是尝试下面
select format('%T', col1) col1, format('%T', col2) col2 from (
  select struct("s1","s2","s3") col1
  , array(select "a1" union all select "a2" union all select "a3") col2
  union all
  select struct("s4","s5","s6")
  , array(select "a4" union all select "a5" union all select "a6")
)
我在BigQuery控制台中多次使用这个技巧,以获得更好的视图,从而使结果更紧凑,更易于吞咽。
页面原文内容由Stack Overflow提供。腾讯云小微IT领域专用引擎提供翻译支持
原文链接:
https://stackoverflow.com/questions/74187430
复制相关文章
相似问题
腾讯云开发者

Copyright © 2013 - 2026 Tencent Cloud. All Rights Reserved. 腾讯云 版权所有
深圳市腾讯计算机系统有限公司 ICP备案/许可证号:粤B2-20090059 ![]() 粤公网安备44030502008569号
粤公网安备44030502008569号
腾讯云计算(北京)有限责任公司 京ICP证150476号 | 京ICP备11018762号