
在{ggplot}中尝试使用check_aesthetics时出现geom_rug错误
在{ggplot}中尝试使用check_aesthetics时出现geom_rug错误
提问于 2022-10-24 17:20:39
我试图用内置在R中的“瑞士”数据框架绘制一个地块,我试图在生育率~教育地块上添加地毯,但只为50%以上的男性从事农业职业的省份绘制地毯。下面是我到目前为止掌握的代码:
ggplot(data = swiss) +
  geom_point(mapping = aes(x = Education, y = Fertility)) +
  geom_smooth(method = "lm", aes(x = Education, y = Fertility), se = FALSE) +
  geom_smooth(method = "loess", aes(x = Education, y = Fertility,
                                    col = "red"),
              linetype = "dotted",
              lwd = 2,
              se = FALSE) +
  geom_rug(mapping = aes(x = Education[Agriculture >= 50], y = Fertility[Agriculture >= 50]),
           color = "blue")
当我运行这段代码时,我在check_aesthetics():美学中接收到错误: error必须长度为1或与data (47)、x和y相同。
我知道这两个子集都等于26,我已经尝试过先将数据(x和y)插入,然后运行代码,但这在fortify()中给出了一个错误。即使在我将子集数据作为数据帧调用之后,fortify()错误也会发生。
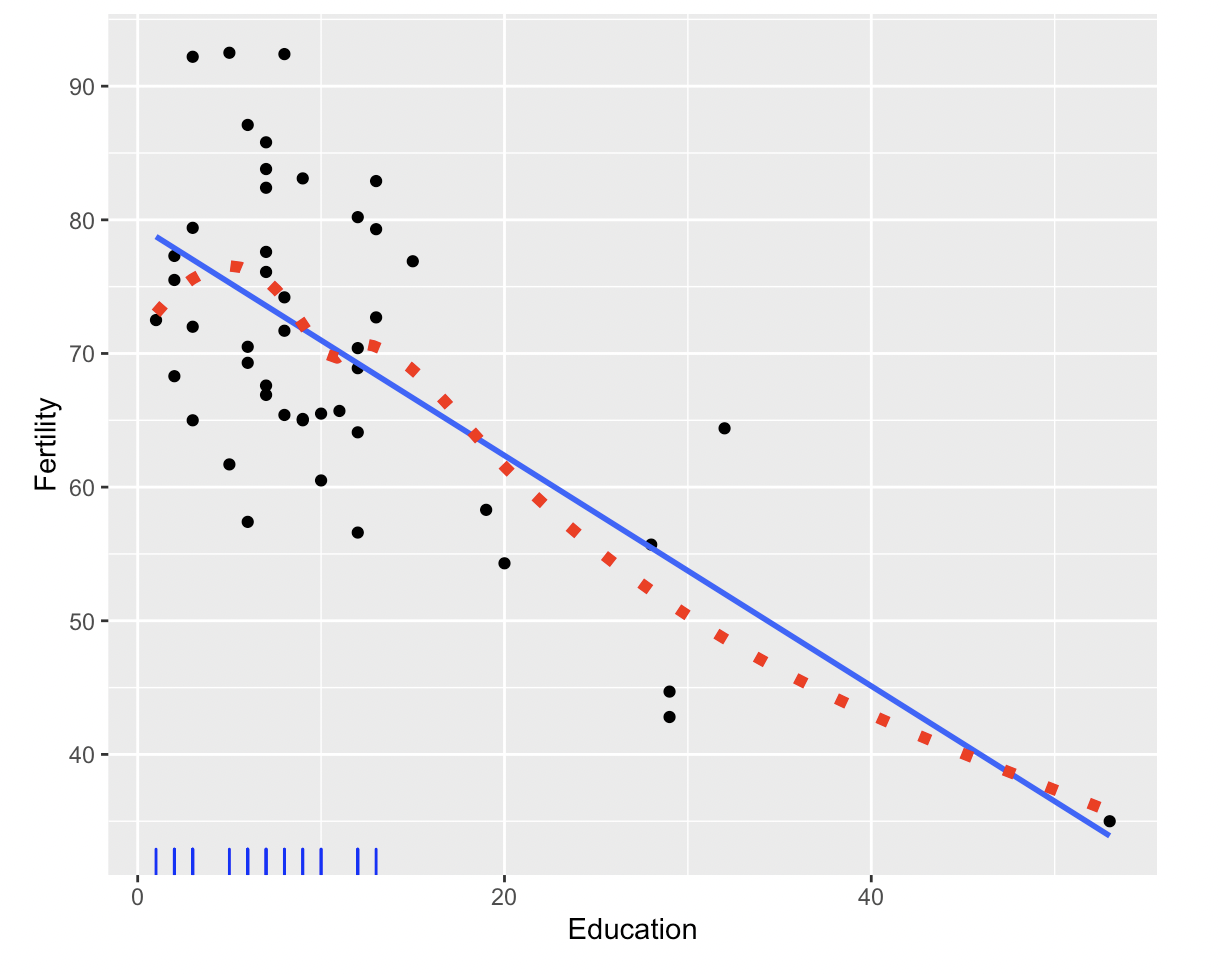
我不知道下一步该做什么,所以任何建议都是有帮助的。这是情节应该是什么样子,以供参考。
预期产出
Yi2T8.png
回答 1
Stack Overflow用户
回答已采纳
发布于 2022-10-24 17:27:31
问题是,你子集的向量。而是对用于geom_rug的数据进行子集
library(ggplot2)
ggplot(data = swiss) +
geom_point(mapping = aes(x = Education, y = Fertility)) +
geom_smooth(method = "lm", aes(x = Education, y = Fertility), se = FALSE) +
geom_smooth(
method = "loess", aes(
x = Education, y = Fertility,
col = "red"
),
linetype = "dotted",
lwd = 2,
se = FALSE
) +
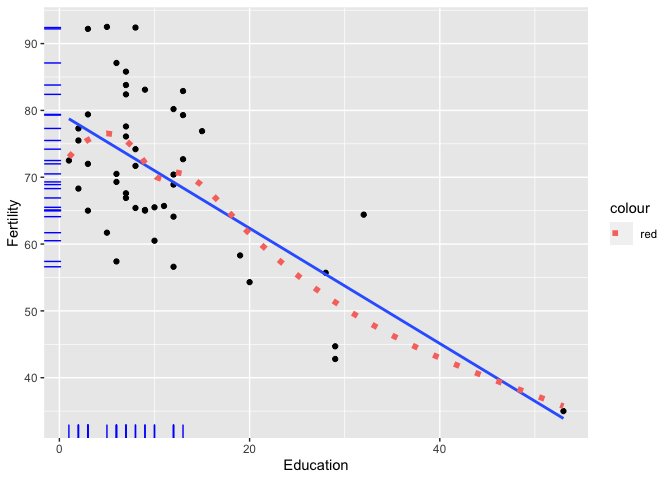
geom_rug(
data = subset(swiss, Agriculture >= 50), mapping = aes(x = Education, y = Fertility),
color = "blue"
)
#> `geom_smooth()` using formula 'y ~ x'
#> `geom_smooth()` using formula 'y ~ x'
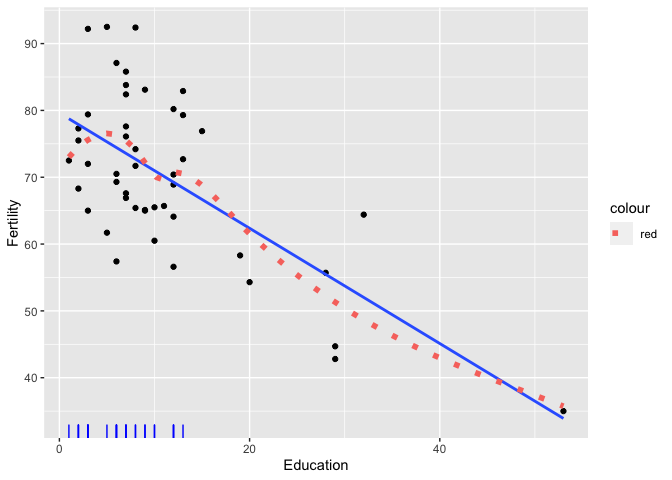
为了只在底部显示地毯,就像你发布的图片一样,你必须设置sides="b"。
library(ggplot2)

ggplot(data = swiss) +
  geom_point(mapping = aes(x = Education, y = Fertility)) +
  geom_smooth(method = "lm", aes(x = Education, y = Fertility), se = FALSE) +
  geom_smooth(
    method = "loess", aes(
      x = Education, y = Fertility,
      col = "red"
    ),
    linetype = "dotted",
    lwd = 2,
    se = FALSE
  ) +
  geom_rug(
    data = subset(swiss, Agriculture >= 50), mapping = aes(x = Education, y = Fertility),
    color = "blue",
    sides = "b"
  )
#> `geom_smooth()` using formula 'y ~ x'
#> `geom_smooth()` using formula 'y ~ x'
页面原文内容由Stack Overflow提供。腾讯云小微IT领域专用引擎提供翻译支持
原文链接:
https://stackoverflow.com/questions/74184659
复制相关文章
相似问题
腾讯云开发者

Copyright © 2013 - 2026 Tencent Cloud. All Rights Reserved. 腾讯云 版权所有
深圳市腾讯计算机系统有限公司 ICP备案/许可证号:粤B2-20090059 ![]() 粤公网安备44030502008569号
粤公网安备44030502008569号
腾讯云计算(北京)有限责任公司 京ICP证150476号 | 京ICP备11018762号