
减小ggplot2 geom点气泡尺寸
减小ggplot2 geom点气泡尺寸
提问于 2022-10-23 19:15:58
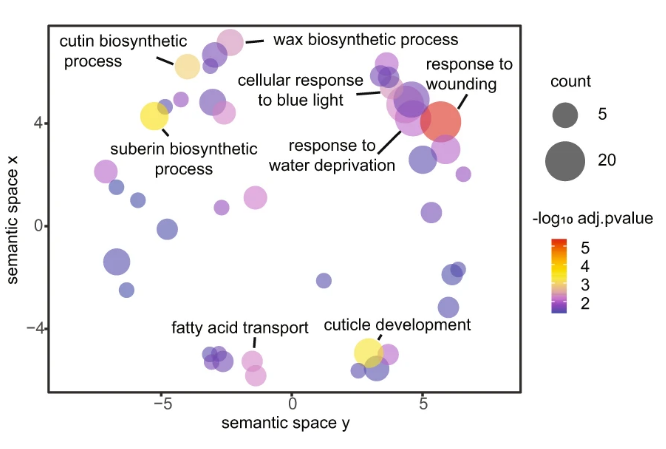
这是我想要看到的
但是我得到了这样的东西--我不能像第一张图中所显示的那样,修复气泡大小和asociateed颜色
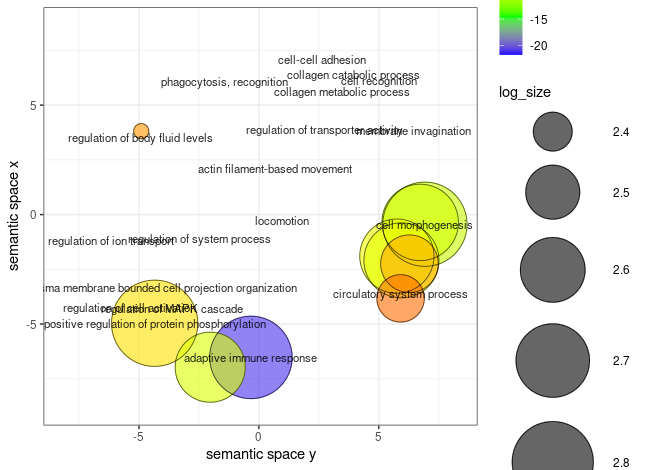
我的代码和使用小子集的数据如下
我的数据
dput(aaa)
structure(list(term_ID = structure(1:10, .Label = c("GO:0000902",
"GO:0000904", "GO:0001501", "GO:0001505", "GO:0001934", "GO:0001944",
"GO:0002250", "GO:0002252", "GO:0003002", "GO:0003012", "GO:0003013",
"GO:0006836", "GO:0006897", "GO:0006909", "GO:0006910", "GO:0006935",
"GO:0006941", "GO:0006954", "GO:0006958", "GO:0006959", "GO:0007160",
"GO:0007167", "GO:0007169", "GO:0007389", "GO:0007599", "GO:0008015",
"GO:0008037", "GO:0009611", "GO:0009617", "GO:0010324", "GO:0030048",
"GO:0030198", "GO:0030574", "GO:0031175", "GO:0031344", "GO:0032409",
"GO:0032940", "GO:0032963", "GO:0032989", "GO:0034330", "GO:0034762",
"GO:0034765", "GO:0035150", "GO:0035239", "GO:0035637", "GO:0035987",
"GO:0040011", "GO:0042060", "GO:0043062", "GO:0043269", "GO:0043408",
"GO:0043410", "GO:0044057", "GO:0045229", "GO:0046903", "GO:0048598",
"GO:0048705", "GO:0050767", "GO:0050808", "GO:0050817", "GO:0050865",
"GO:0050871", "GO:0050878", "GO:0050900", "GO:0051282", "GO:0051960",
"GO:0060284", "GO:0060306", "GO:0070252", "GO:0071345", "GO:0086001",
"GO:0098609", "GO:0098900", "GO:0098901", "GO:0099003", "GO:0099504",
"GO:0099537", "GO:0120035", "GO:0140352", "GO:1903115", "GO:1903522"
), class = "factor"), description = structure(c(7L, 8L, 71L,
60L, 44L, 79L, 3L, 30L, 45L, 36L), .Label = c("actin filament-based movement",
"actin-mediated cell contraction", "adaptive immune response",
"blood circulation", "cardiac muscle cell action potential",
"cell junction organization", "cell morphogenesis", "cell morphogenesis involved in differentiation",
"cell recognition", "cell-cell adhesion", "cell-matrix adhesion",
"cellular component morphogenesis", "cellular response to cytokine stimulus",
"chemotaxis", "circulatory system process", "coagulation", "collagen catabolic process",
"collagen metabolic process", "complement activation, classical pathway",
"embryonic morphogenesis", "endocytosis", "endodermal cell differentiation",
"enzyme-linked receptor protein signaling pathway", "export from cell",
"external encapsulating structure organization", "extracellular matrix organization",
"extracellular structure organization", "hemostasis", "humoral immune response",
"immune effector process", "inflammatory response", "leukocyte migration",
"locomotion", "membrane invagination", "multicellular organismal signaling",
"muscle system process", "neuron projection development", "neurotransmitter transport",
"pattern specification process", "phagocytosis", "phagocytosis, recognition",
"positive regulation of B cell activation", "positive regulation of MAPK cascade",
"positive regulation of protein phosphorylation", "regionalization",
"regulation of actin filament-based movement", "regulation of action potential",
"regulation of blood circulation", "regulation of body fluid levels",
"regulation of cardiac muscle cell action potential", "regulation of cell activation",
"regulation of cell development", "regulation of cell projection organization",
"regulation of ion transmembrane transport", "regulation of ion transport",
"regulation of MAPK cascade", "regulation of membrane repolarization",
"regulation of nervous system development", "regulation of neurogenesis",
"regulation of neurotransmitter levels", "regulation of plasma membrane bounded cell projection organization",
"regulation of sequestering of calcium ion", "regulation of system process",
"regulation of transmembrane transport", "regulation of transporter activity",
"regulation of tube size", "response to bacterium", "response to wounding",
"secretion", "secretion by cell", "skeletal system development",
"skeletal system morphogenesis", "striated muscle contraction",
"synapse organization", "synaptic vesicle cycle", "trans-synaptic signaling",
"transmembrane receptor protein tyrosine kinase signaling pathway",
"tube morphogenesis", "vasculature development", "vesicle-mediated transport in synapse",
"wound healing"), class = "factor"), frequency = c(3.90388708412681,
3.0469362607819, 2.85650274448303, 1.22101489862216, 4.17833538702812,
2.92371457376498, 3.67984765318696, 2.54284754116725, 1.89313319144169,
1.57387700235241), plot_X = c(6.92244115457684, 6.72491915133615,
5.75342433388847, -4.90486321695327, -4.34558231048815, 5.9436291821168,
-0.331063511422281, -2.02986678951973, 6.27772046499967, 5.90846183785093
), plot_Y = c(-0.441477421046203, -0.357893626091624, -1.89830400195803,
3.81175482612134, -4.96413463620965, -2.091036211506, -6.52348278338337,
-6.97095859836097, -2.24397905128075, -3.82681903766349), log_size = c(2.84385542262316,
2.73639650227664, 2.70842090013471, 2.34044411484012, 2.8733206018154,
2.71850168886727, 2.81822589361396, 2.65801139665711, 2.53019969820308,
2.45024910831936), value = c(-9.8138097104, -9.3084572558, -7.983023664,
-3.2017781871001, -6.0366705271, -8.4472753844, -21.0694271164,
-9.0630211246, -3.94894435910093, -1.87037981820001), uniqueness = c(0.857575132627072,
0.816670053918386, 0.841547228295729, 0.886390429364808, 0.807466832663465,
0.830691169997519, 0.839912555176311, 0.892202047678151, 0.847227910985189,
0.868600113222042), dispensability = c(0, 0.69190667, 0.44917845,
0.379708, 0.14243226, 0.45070828, 0, 0.57560152, 0.40006623,
0.55626845)), row.names = c(NA, 10L), class = "data.frame")所使用的代码,我试图将小数点乘成size参数输入,即log_size,但仍然不能使它与颜色成比例。
p1 <- ggplot( data = aaa );
p1 <- p1 + geom_point( aes( plot_X, plot_Y, colour = value, size = log_size), alpha = I(0.6) );
p1 <- p1 + scale_colour_gradientn( colours = c("blue", "green", "yellow", "red"), limits = c( min(one.data$value), 0) );
p1 <- p1 + geom_point( aes(plot_X, plot_Y, size = log_size), shape = 21, fill = "transparent", colour = I (alpha ("black", 0.6) ));
p1 <- p1 + scale_size( range=c(5, 30)) + theme_bw(); # + scale_fill_gradientn(colours = heat_hcl(7), limits = c(-300, 0) );
ex <- one.data [ one.data$dispensability < 0.15, ];
p1 <- p1 + geom_text( data = ex, aes(plot_X, plot_Y, label = description), colour = I(alpha("black", 0.85)), size = 3 );
p1 <- p1 + labs (y = "semantic space x", x = "semantic space y");
p1 <- p1 + theme(legend.key = element_blank()) ;
one.x_range = max(one.data$plot_X) - min(one.data$plot_X);
one.y_range = max(one.data$plot_Y) - min(one.data$plot_Y);
p1 <- p1 + xlim(min(one.data$plot_X)-one.x_range/10,max(one.data$plot_X)+one.x_range/10);
p1 <- p1 + ylim(min(one.data$plot_Y)-one.y_range/10,max(one.data$plot_Y)+one.y_range/10);


# --------------------------------------------------------------------------
# Output the plot to screen

p1;
如有任何建议或帮助,将不胜感激。
回答 2
Stack Overflow用户
回答已采纳
发布于 2022-10-24 01:12:47
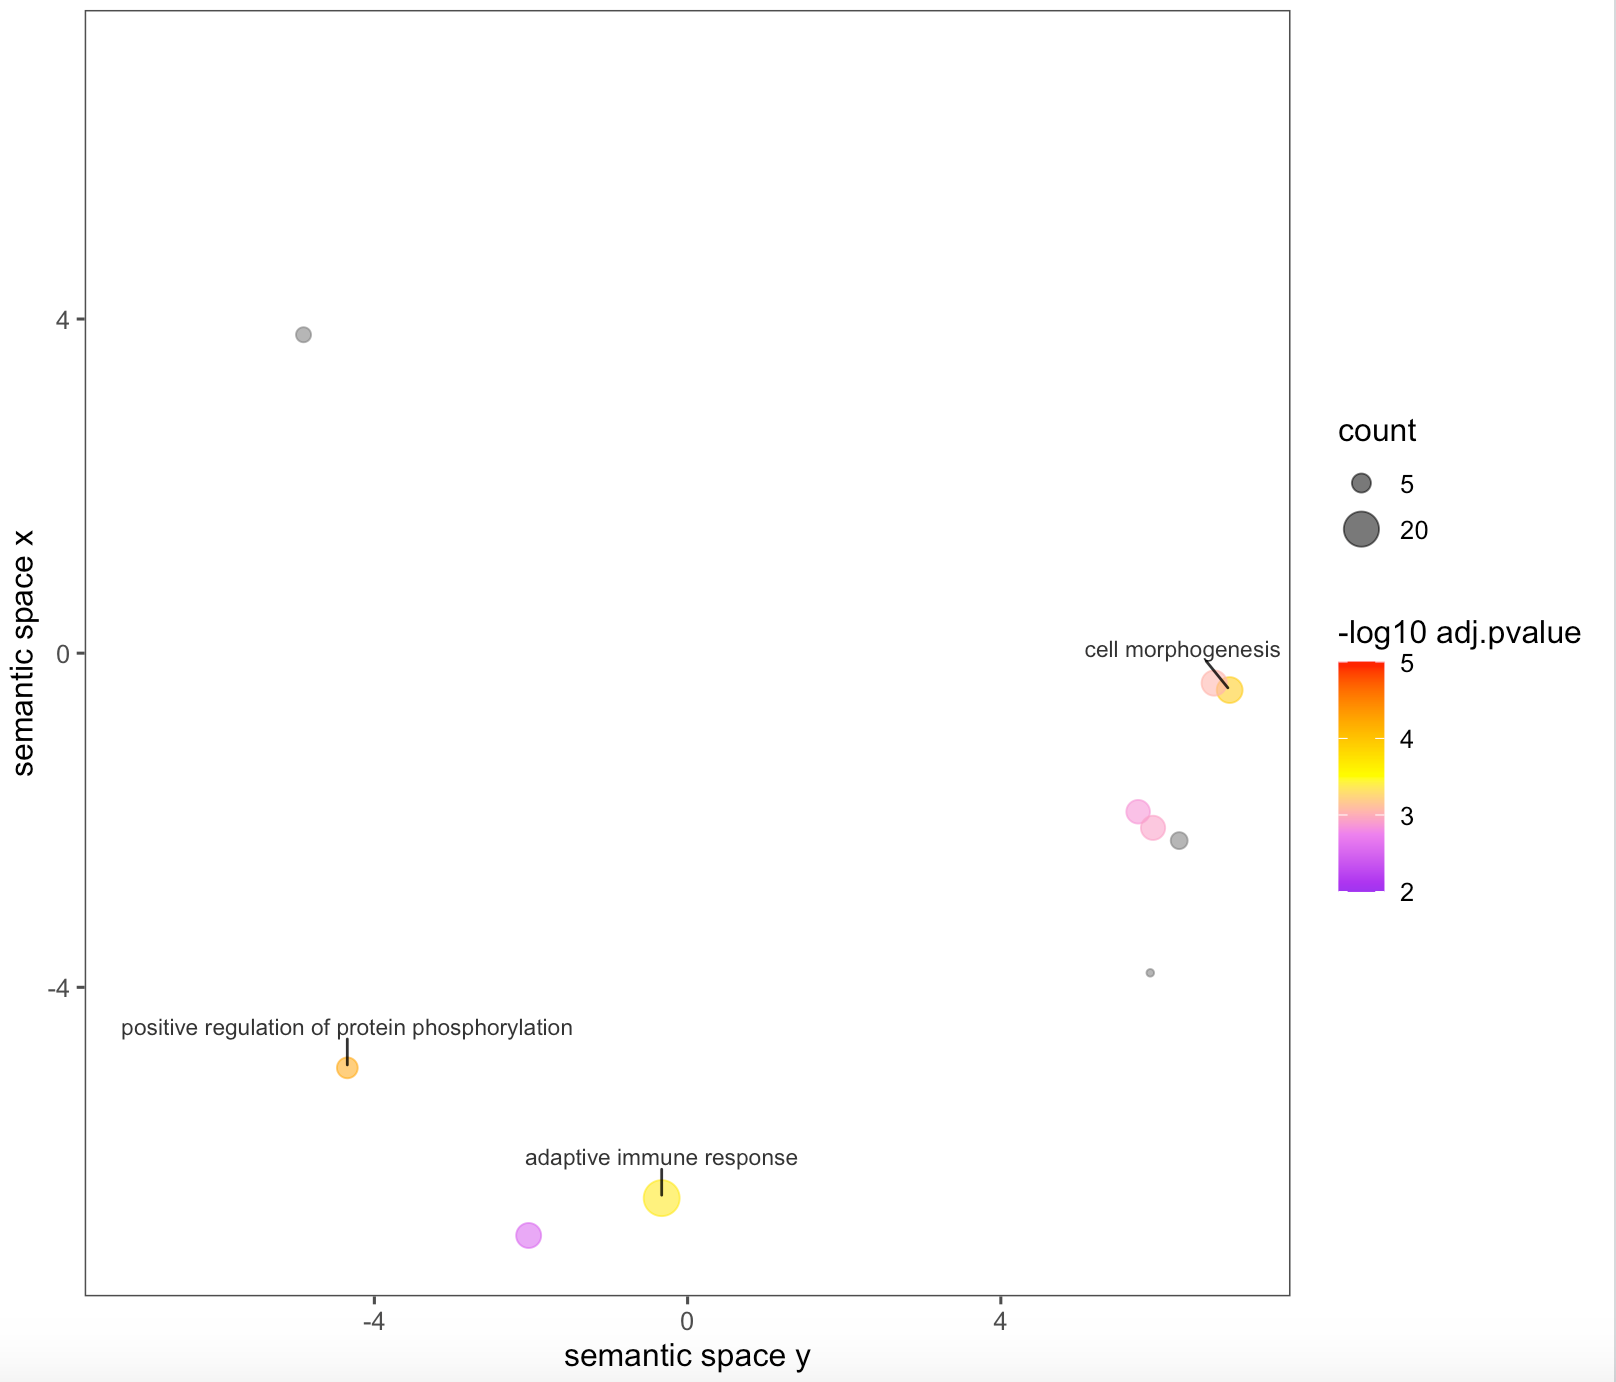
我觉得这有点接近原版。注意,我更改了正在绘制的字段,因为您所选择的值与示例没有对齐。
library(ggplot2)
library(ggrepel)
library(ggthemes)

ex <- aaa[aaa$dispensability < 0.15, ]

ggplot(data = aaa )+
    geom_point( aes( plot_X, plot_Y, colour = frequency, size = -value), alpha = I(0.6) )+
    scale_colour_gradientn(colours = c("purple", "violet", "yellow", "orange", "red"),
                           limits = c(ceiling(min(aaa$frequency)), ceiling(max(aaa$frequency))))+
    scale_size_continuous(breaks = seq(from = 5, to = round(max(-aaa$value),-1), length.out = 2 ))+
    geom_text_repel(data = ex, aes(plot_X, plot_Y, label = description), colour = I(alpha("black", 0.85)), size = 3 ,
                    min.segment.length = 0, nudge_y = 0.5)+
    xlim(-ceiling(max(abs(min(aaa$plot_X)), abs(max(aaa$plot_X)))), ceiling(max(abs(min(aaa$plot_X)), abs(max(aaa$plot_X))))) +
    ylim(-ceiling(max(abs(min(aaa$plot_Y)), abs(max(aaa$plot_Y)))), ceiling(max(abs(min(aaa$plot_Y)), abs(max(aaa$plot_Y))))) +
    labs(x = "semantic space y", y = "semantic space x", color = "-log10 adj.pvalue", size = "count") +
    theme_few()
Stack Overflow用户
发布于 2022-10-23 22:54:43
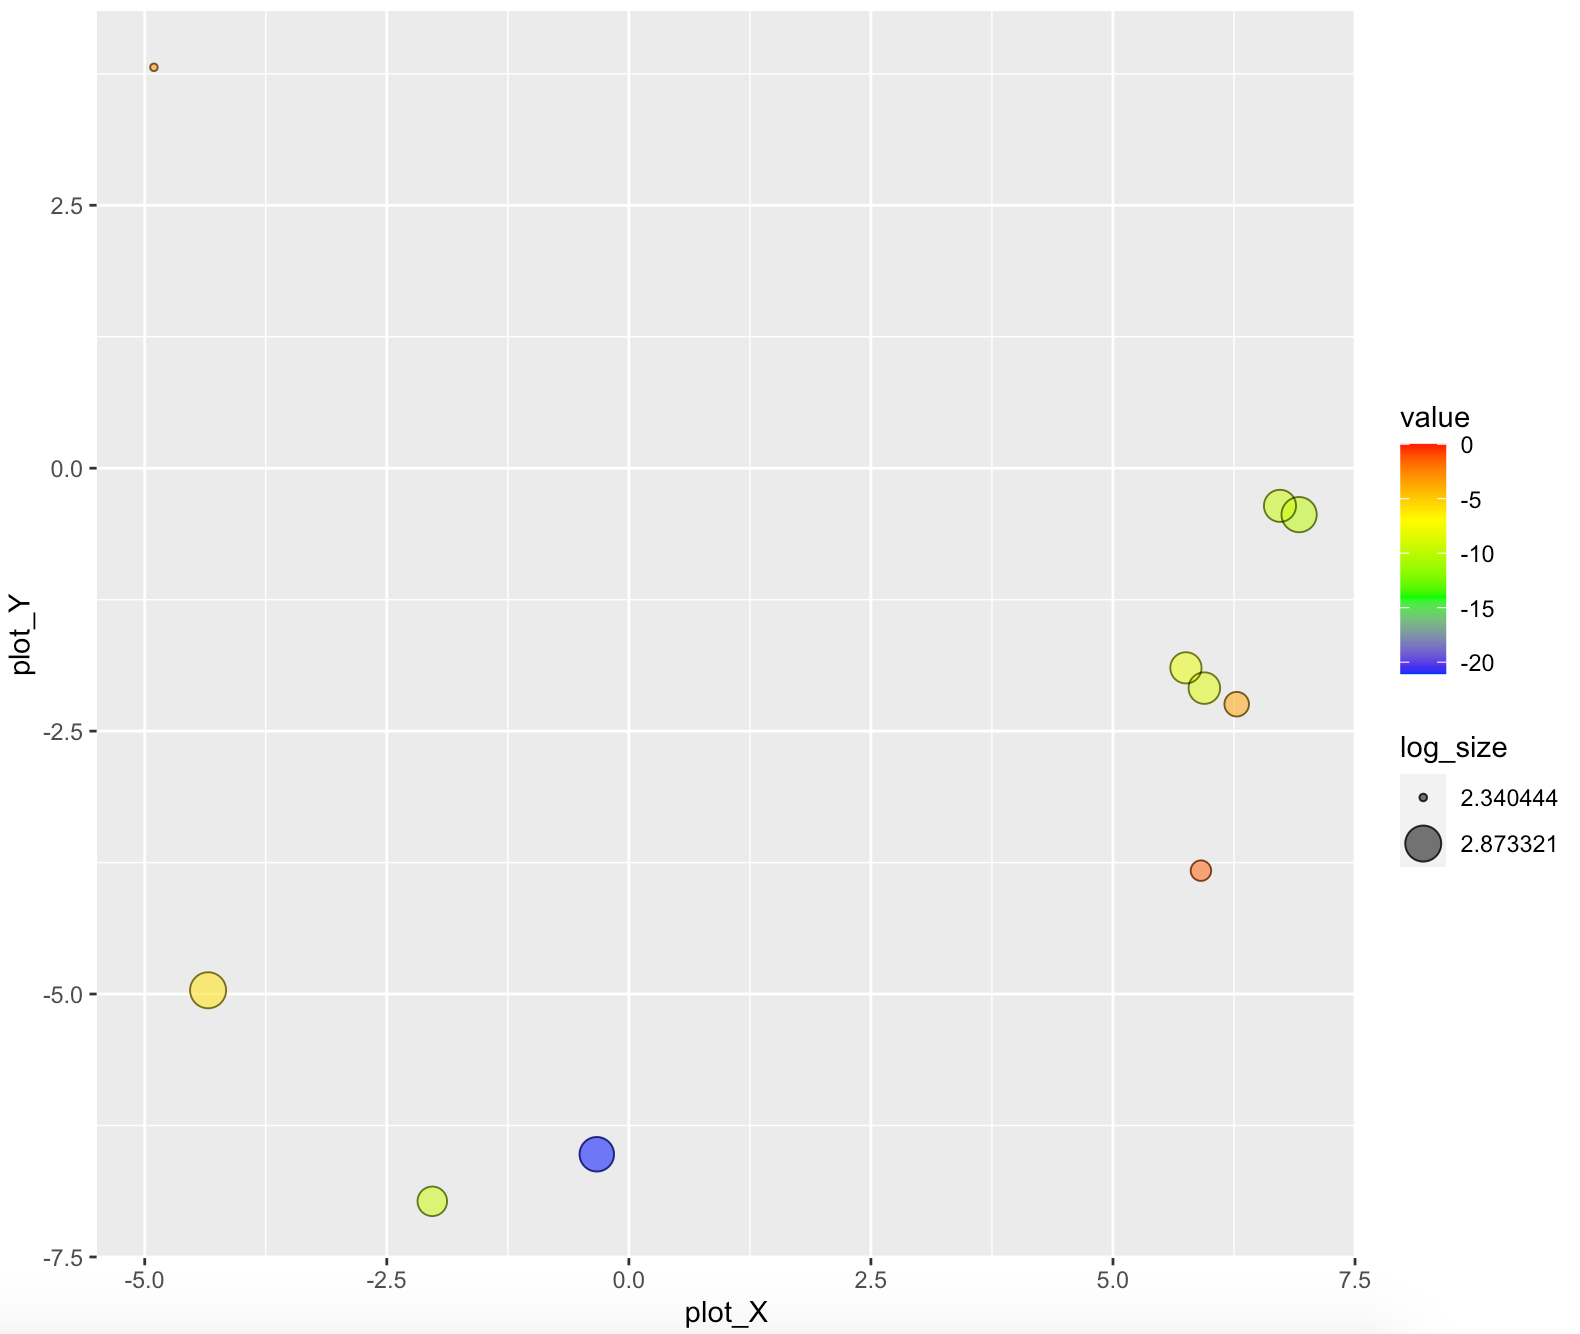
这就是你想要做的尺寸传奇吗?现在还不清楚你想用不同的颜色做什么。显然,您有不同的值,您正在映射,所以您有不同的结果。
ggplot(data = aaa )+
    geom_point( aes( plot_X, plot_Y, colour = value, size = log_size), alpha = I(0.6) )+
    scale_colour_gradientn( colours = c("blue", "green", "yellow", "red"), limits = c( min(aaa$value), 0) )+
    geom_point( aes(plot_X, plot_Y, size = log_size), shape = 21, fill = "transparent", colour = I (alpha ("black", 0.6) ))+
    scale_size_continuous(breaks = seq(range(aaa$log_size)[1], range(aaa$log_size)[2], length.out = 2))
页面原文内容由Stack Overflow提供。腾讯云小微IT领域专用引擎提供翻译支持
原文链接:
https://stackoverflow.com/questions/74174075
复制相关文章
相似问题
腾讯云开发者

Copyright © 2013 - 2026 Tencent Cloud. All Rights Reserved. 腾讯云 版权所有
深圳市腾讯计算机系统有限公司 ICP备案/许可证号:粤B2-20090059 ![]() 粤公网安备44030502008569号
粤公网安备44030502008569号
腾讯云计算(北京)有限责任公司 京ICP证150476号 | 京ICP备11018762号