
当尝试使用lidR包在R中生成DSM (数字表面模型)时,我得到了错误:没有找到第一次返回。操作中止
基本上就是标题上说的。我有一个.las三维点云文件,我试图把它转换成R.
我使用这段代码来实现DSM
dsm_2L<- grid_canopy(las = pc, res = 0.1, algorithm = dsmtin())

Error: No first returns found. Operation aborted.
我怎么能费劲拍这个来找出它为什么不返回任何价值呢?
回答 1
Stack Overflow用户
发布于 2022-10-23 17:17:40
这些数据是非常可怕的,但是可以用它来做一些事情,我在lidR -这本书中有更多的东西要复习,但是我可以在RGB的地块上四处寻找,
pc_las <- readLAS('~/Downloads/pc.las')
Warning messages:
1: Invalid data: 2266197 points with a return number equal to 0 found.
2: Invalid data: 2266197 points with a number of returns equal to 0 found.


> canopy_p2r <- rasterize_canopy(pc_las, res = 0.1, algorithm = p2r(0.2))
# p2r(0.2) enlarges point to disc, improves result image
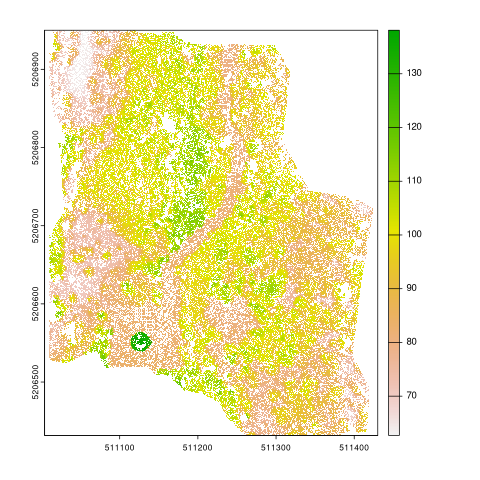
在看plot(pc_las, color= RGB)的时候有个线索。你可以看到一个‘水塔’,但范围说,你不可能看到的。注意研究区域的一个dem的左下角的红色区域。
在这里,点击/挑出canopy_p2r周围的点,形成一个多边形来进行裁剪。
plot(canopy_p2r)
pts <- click(canopy_p2r, n=30, xy = TRUE)
pts_mtx <- as.matrix(pts[, 1:2])
can_poly <- vect(pts_mtx, type= 'polygons', crs = 'EPSG:32610')
can_poly_4326 <- project(can_poly, 'EPSG:4326')
ext(can_poly_4326)
SpatExtent : -122.855230404662, -122.849695629639, 47.0111456525597, 47.0158802976408 (xmin, xmax, ymin, ymax)
使用SpatExtent at NASA-EarthData获得一个Aster。注意:键入,不要在‘按矩形选择’中复制/粘贴xmin& etc,因为它们(合理吗?)期待SQL注入,它将反复执行fail...sigh。
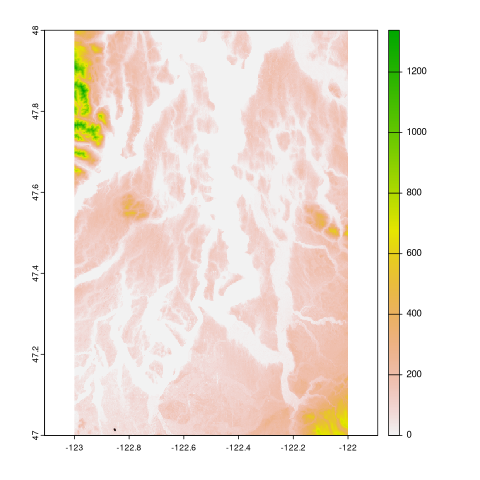
ast_dem <- rast('~/Downloads/ASTGTMV003_N47W123_dem.tif')
# crop ast_dem by can_poly_4326
ast_crop_4326 <- crop(ast_dem, can_poly_4326)
# project this to EPSG:32610
ast_crop_32610 <- project(ast_crop_4326, 'EPSG:32610')
ext(ast_crop_32610)
SpatExtent : 511009.866154932, 511420.434414284, 5206436.81511609, 5206950.02544028 (xmin, xmax, ymin, ymax)
看看?lidR::clip_rectangle,我们看到它想要一个与out SpatExtent返回的顺序不同的顺序,但是我们希望尽可能地去除多余的NA。
clip_pc <- clip_rectangle(pc_las, xleft=unname(ext(ast_crop_32610)[c(1,3,2,4)][1]), ybottom = unname(ext(ast_crop_32610)[c(1,3,2,4)][2]), xright=unname(ext(ast_crop_32610)[c(1,3,2,4)][3]), ytop=unname(ext(ast_crop_32610)[c(1,3,2,4)][4]))
library(rgl)
x = plot(clip_pc, bg = 'white', size = 3)
add_dtm3d(x, ast_crop_32610)
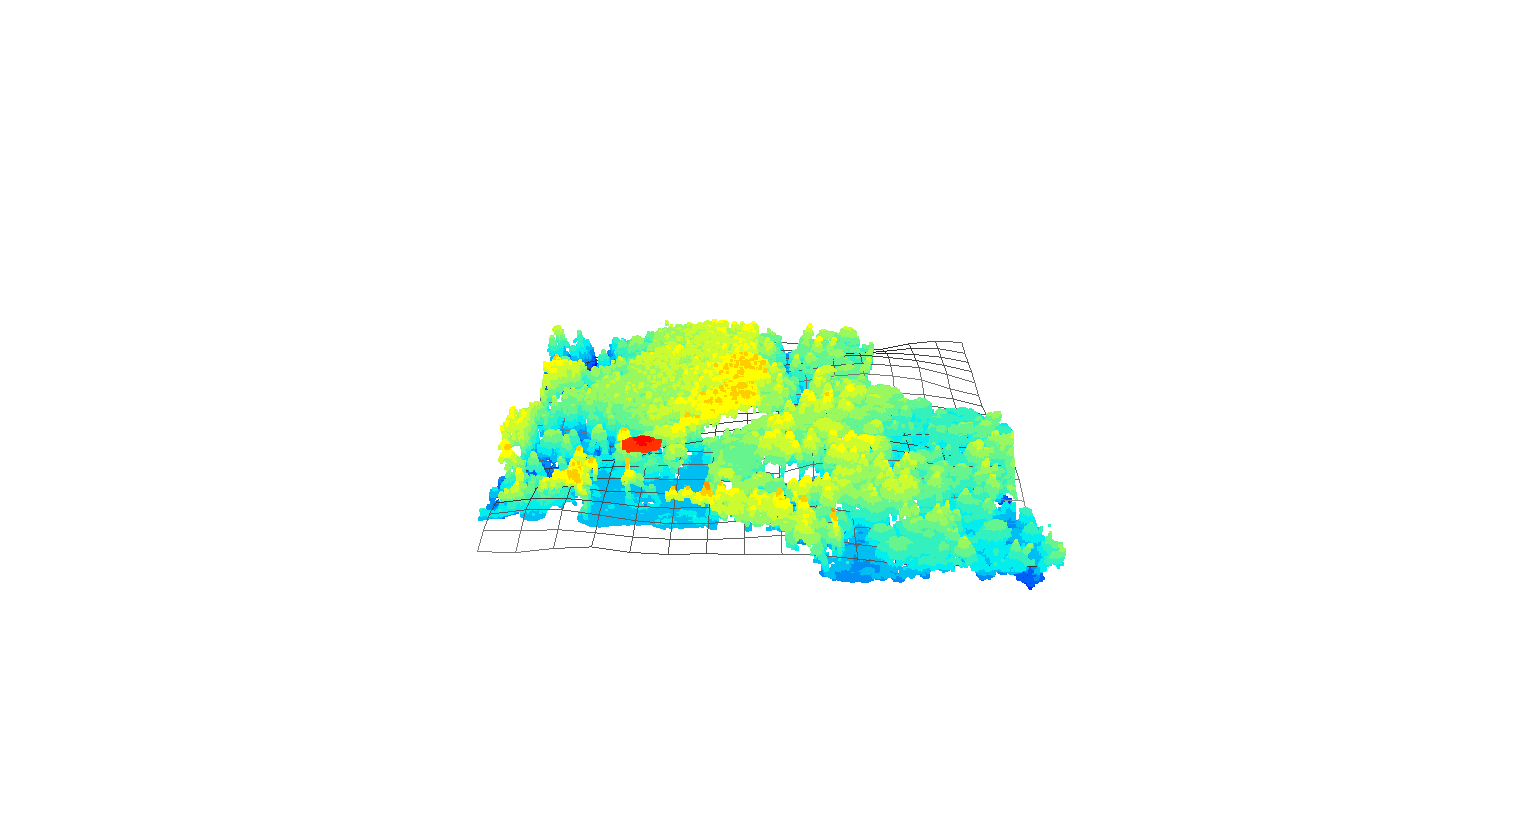
现在,(假设这一切不是不必要的)我们可以继续讨论分类问题.
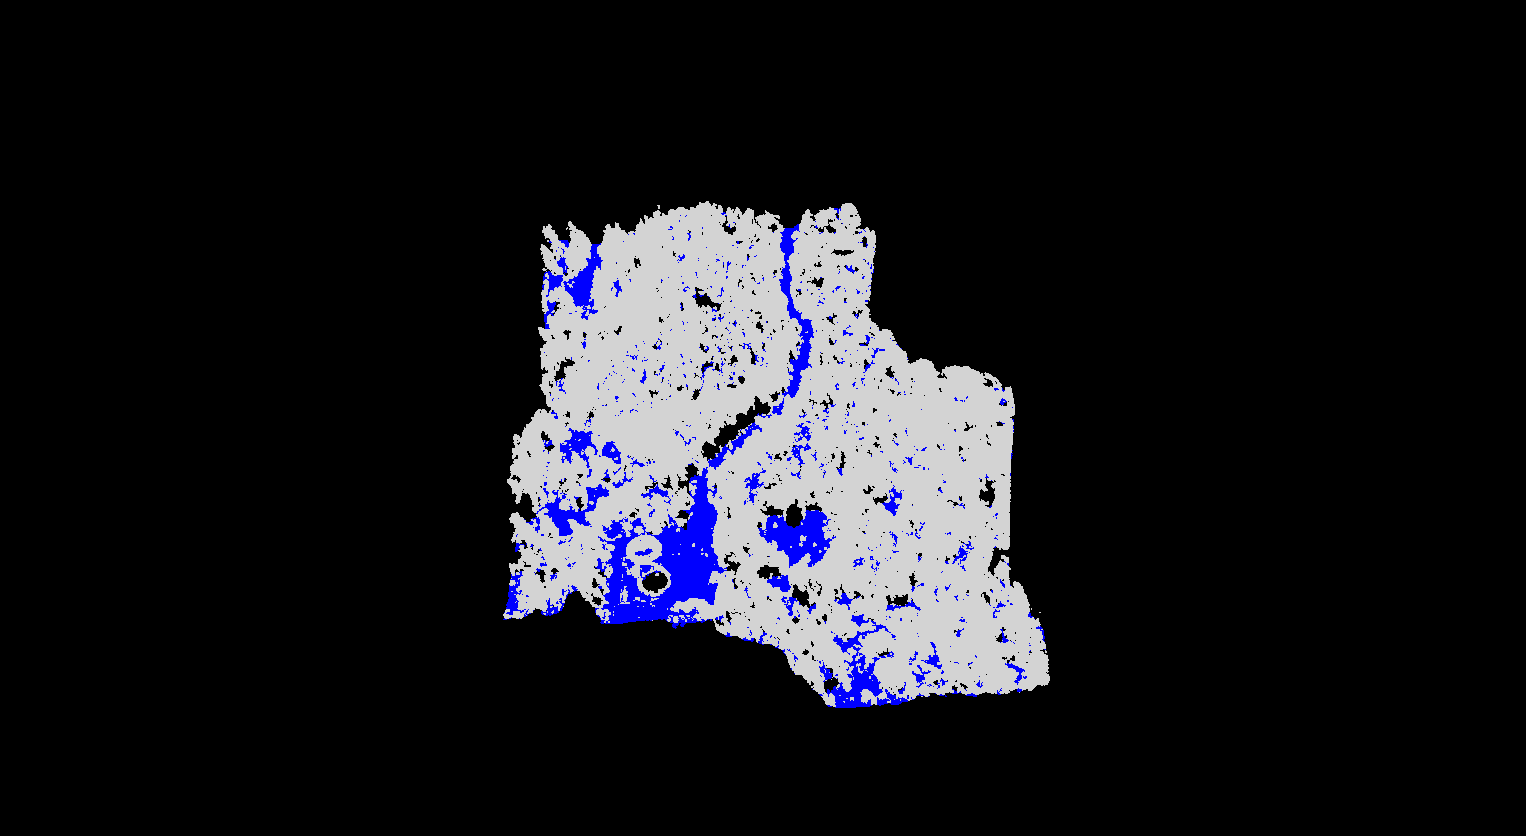
# install.packages('RCSF', dependencies = TRUE) uncomment if needed
mycsf <- csf(TRUE, 1, 1, time_step = 1)
clip_pc <- classify_ground(clip_pc, mycsf)
plot(clip_pc, color = 'Classification')
我们似乎要有所进展..。蓝色是地面,灰色/黑色不是地面。现在,如何把塔转到“2”。
#returning to the click approach for 'water tower'
plot(canopy_p2r)
pts_tower <- click(canopy_p2r, n = 6, xy = TRUE)
pts_tower[7, ] <- pts_tower[1, ]
tower_roi <- st_polygon(list(as.matrix(pts_tower[, 1:2])))
# classify tower
clip_pc <- classify_poi(clip_pc, LASBUILDING, roi = st_sfc(tower_roi, crs = 32610), inverse = FALSE)
poi <- ~Classification !=LASGROUND
clip_pc <- classify_poi(clip_pc, LASHIGHVEGETATION, poi = poi, roi = st_sfc(tower_roi, crs = 32610), inverse = TRUE)在这一点上,事情是‘批量’分类,但仍然存在‘回报’的问题。但是我想我们要做的第一件事是normalization,同时我们进一步研究是否可以在事后评估returns。留到这里
writeLAS(clip_pc, file = 'semi_processed.las', index = TRUE)期待在first_returns上取得一些进展。更有可能不是。任何返回都需要时间戳。
summary(clip_pc@data)
       X                Y                 Z             gpstime    Intensity
 Min.   :511010   Min.   :5206432   Min.   : 62.66   Min.   :0   Min.   :0
 1st Qu.:511113   1st Qu.:5206581   1st Qu.: 84.13   1st Qu.:0   1st Qu.:0
 Median :511206   Median :5206675   Median : 94.45   Median :0   Median :0
 Mean   :511204   Mean   :5206684   Mean   : 92.93   Mean   :0   Mean   :0
 3rd Qu.:511289   3rd Qu.:5206784   3rd Qu.:100.75   3rd Qu.:0   3rd Qu.:0
 Max.   :511424   Max.   :5206950   Max.   :138.43   Max.   :0   Max.   :0
  ReturnNumber NumberOfReturns ScanDirectionFlag EdgeOfFlightline
 Min.   :0     Min.   :0       Min.   :0         Min.   :0
 1st Qu.:0     1st Qu.:0       1st Qu.:0         1st Qu.:0
 Median :0     Median :0       Median :0         Median :0
 Mean   :0     Mean   :0       Mean   :0         Mean   :0
 3rd Qu.:0     3rd Qu.:0       3rd Qu.:0         3rd Qu.:0
 Max.   :0     Max.   :0       Max.   :0         Max.   :0
 Classification Synthetic_flag  Keypoint_flag   Withheld_flag   ScanAngleRank
 Min.   :2.00   Mode :logical   Mode :logical   Mode :logical   Min.   :0
 1st Qu.:5.00   FALSE:2232003   FALSE:2232003   FALSE:2232003   1st Qu.:0
 Median :5.00                                                   Median :0
 Mean   :4.34                                                   Mean   :0
 3rd Qu.:5.00                                                   3rd Qu.:0
 Max.   :6.00                                                   Max.   :0
    UserData PointSourceID       R               G               B
 Min.   :0   Min.   :0     Min.   :    0   Min.   : 3328   Min.   :  256
 1st Qu.:0   1st Qu.:0     1st Qu.:16384   1st Qu.:24832   1st Qu.:17408
 Median :0   Median :0     Median :28672   Median :36096   Median :24832
 Mean   :0   Mean   :0     Mean   :28732   Mean   :35534   Mean   :25653
 3rd Qu.:0   3rd Qu.:0     3rd Qu.:40192   3rd Qu.:46336   3rd Qu.:32512
 Max.   :0   Max.   :0     Max.   :65280   Max.   :65280   Max.   :65280

length(which(clip_pc@data$Classification == 0))
[1] 0好吧,一切都是保密的,如果不恰当的话。如果没有时间戳,就像上面所缺少的那样,很难“填充”/创建返回等等。但不是一场彻底的失败。给定这些当前对象,仍然可以执行normalization:这是用户的练习。最好问问,是谁发的这些数据,你从哪里得到的?
https://stackoverflow.com/questions/74156129
复制相似问题
腾讯云开发者

Copyright © 2013 - 2026 Tencent Cloud. All Rights Reserved. 腾讯云 版权所有
深圳市腾讯计算机系统有限公司 ICP备案/许可证号:粤B2-20090059 ![]() 粤公网安备44030502008569号
粤公网安备44030502008569号
腾讯云计算(北京)有限责任公司 京ICP证150476号 | 京ICP备11018762号