
在Python中使用Matplotlib进行波形编码
在Python中使用Matplotlib进行波形编码
提问于 2022-10-12 22:44:57
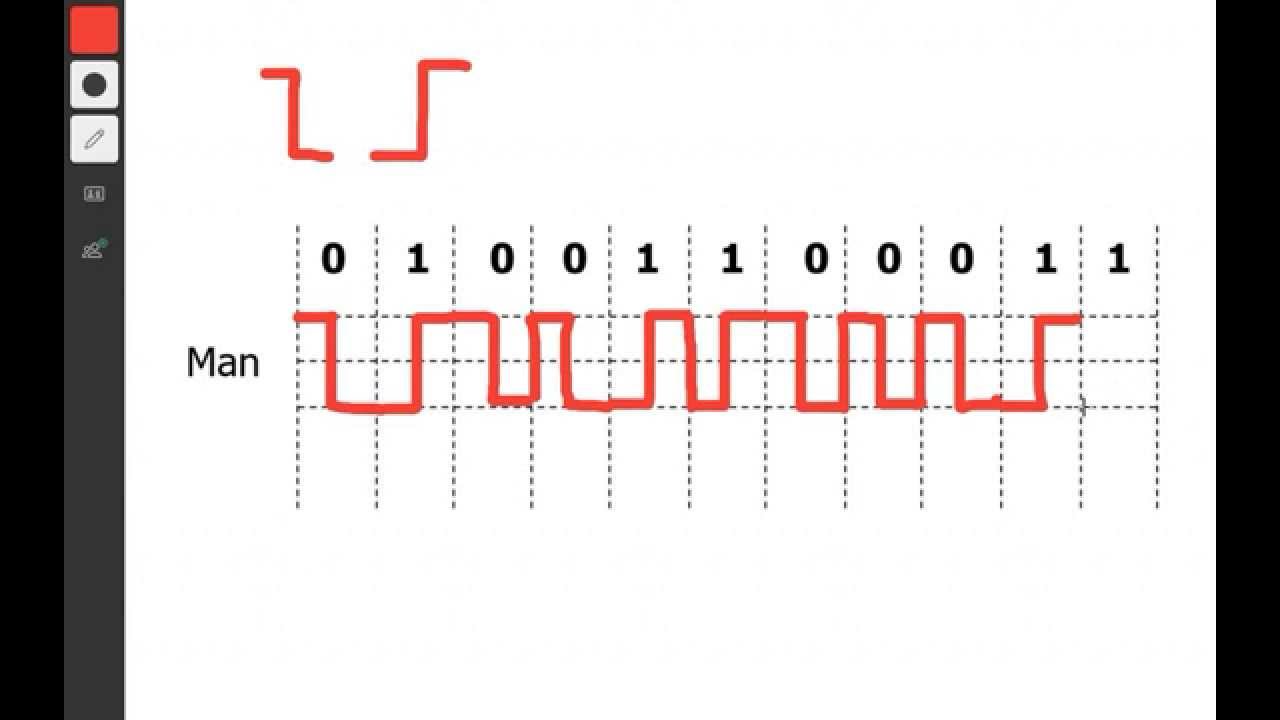
有没有可能用python中的matplotlib绘制编码图?假设我有一个"01001100011“的数据字符串。我想用python中的matplotlib绘制像图片这样的编码图。
回答 1
Stack Overflow用户
发布于 2022-10-12 23:22:57
你可以这样做。
import numpy as np
import matplotlib.pyplot as plt


s = "01001100011" # string to be encoded

x_max = len(s)+1

# generate waveform encoding scheme
zero_form = np.array([[0,1],[0.5,1],[0.5,0],[1,0]])
one_form = zero_form.copy()
one_form[:,1] = 1 - zero_form[:,1]
encoding = [zero_form,one_form]

# encode the string s
waveform = np.vstack([x + np.array([i,0]) for i,c in enumerate(s)
                                          for x in encoding[int(c)]])

plt.figure(figsize = (15,3))

# plot grid
for y in [0,.5,1]:
    plt.plot([0,x_max],[y,y],'k--')
for x in range(1,x_max):
    plt.plot([x,x],[0,1.5],'k--')

# plot 0,1 labels
for i,c in enumerate(s):
    plt.text(i+.3,1.2,c, fontsize = 30)

plt.plot(*waveform.T,'r', lw = 10, alpha = .5) # plot waveform
plt.axis("off")                               # turn of axes/labels
plt.show()
由此得出的数字:

页面原文内容由Stack Overflow提供。腾讯云小微IT领域专用引擎提供翻译支持
原文链接:
https://stackoverflow.com/questions/74048706
复制相关文章
相似问题
腾讯云开发者

Copyright © 2013 - 2026 Tencent Cloud. All Rights Reserved. 腾讯云 版权所有
深圳市腾讯计算机系统有限公司 ICP备案/许可证号:粤B2-20090059 ![]() 粤公网安备44030502008569号
粤公网安备44030502008569号
腾讯云计算(北京)有限责任公司 京ICP证150476号 | 京ICP备11018762号