
创建多个条形图,具体取决于R +ggplot中的列
创建多个条形图,具体取决于R +ggplot中的列
提问于 2022-10-11 10:04:10
我试图使用列作为分隔符在同一输出上创建多个条形图,但我只能创建单个图表。它现在作为一种功能,以便同时完成所有的事情。
library("skimr")
library("tidyverse")
library("ggplot2")

V1 <- c(2,4,2,1,4)
V2 <- c(5,2,2,1,3)
V3 <- c(2,4,3,3,3)
V4 <- c(2,1,1,1,2)

df <- data.frame(V1,V2,V3,V4)

  lapply(names(df), function(col) {
  ggplot(df, aes(.data[[col]], ..count..), beside=TRUE) +
    geom_bar() +
    theme_minimal()+
    coord_cartesian(xlim = c(0, 5), ylim = c(0, 5))+
    scale_x_discrete(labels=c("1" = "Not relevant", "2" = "2","3" = "3","4" = "4", "5" = "Highly relevant"), na.value = FALSE)
})回答 1
Stack Overflow用户
发布于 2022-10-11 10:33:35
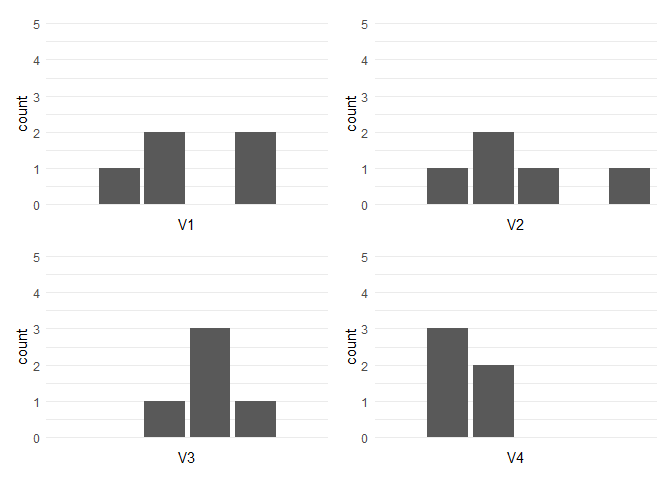
您可以尝试patchwork::wrap_plots()来绘制情节列表:
library("ggplot2")

V1 <- c(2, 4, 2, 1, 4)
V2 <- c(5, 2, 2, 1, 3)
V3 <- c(2, 4, 3, 3, 3)
V4 <- c(2, 1, 1, 1, 2)

df <- data.frame(V1, V2, V3, V4)

lapply(names(df), function(col) {
  ggplot(df, aes(.data[[col]], ..count..), beside = TRUE) +
    geom_bar() +
    theme_minimal() +
    coord_cartesian(xlim = c(0, 5), ylim = c(0, 5)) +
    scale_x_discrete(labels = c("1" = "Not relevant", "2" = "2", "3" = "3", "4" = "4", "5" = "Highly relevant"), na.value = FALSE)
}) |> patchwork::wrap_plots()
页面原文内容由Stack Overflow提供。腾讯云小微IT领域专用引擎提供翻译支持
原文链接:
https://stackoverflow.com/questions/74026338
复制相关文章
相似问题
腾讯云开发者

Copyright © 2013 - 2026 Tencent Cloud. All Rights Reserved. 腾讯云 版权所有
深圳市腾讯计算机系统有限公司 ICP备案/许可证号:粤B2-20090059 ![]() 粤公网安备44030502008569号
粤公网安备44030502008569号
腾讯云计算(北京)有限责任公司 京ICP证150476号 | 京ICP备11018762号