
Gnu图:条形图可视化
Gnu图:条形图可视化
提问于 2022-10-11 09:39:46
我的gnuplot脚本用单色或彩色格式绘制二维数据的条形图:
set term pngcairo size 800,600
set termoption noenhanced
set tics font "Helvetica,10"

#set xtics noenhanced
set ylabel "Fraction, %"
set xlabel "H-bond donor/aceptor, residue"
set yrange [0:1]
set ytics 0.1
set grid y
set key off
set boxwidth 0.9
set style fill solid 0.5

# TWO OPTIONS FOR BAR VISUALISATIONS!! NB: ADD HERE TRIGGER FROM COLOR_DATA TRIGGER
# 1 - use it with non-colored bars"
#plot "\$data" using 0:2:xtic(1) with boxes, "" using 0:2:2 with labels offset 0,1
# 2 - or use it with colored bars:
plot \$data using 0:2:3:xtic(1) with boxes lc rgb var, \
        '' using 0:2:2 with labels offset 0,1
当我只有一个条形图的时候,它占用了X上所有的图:
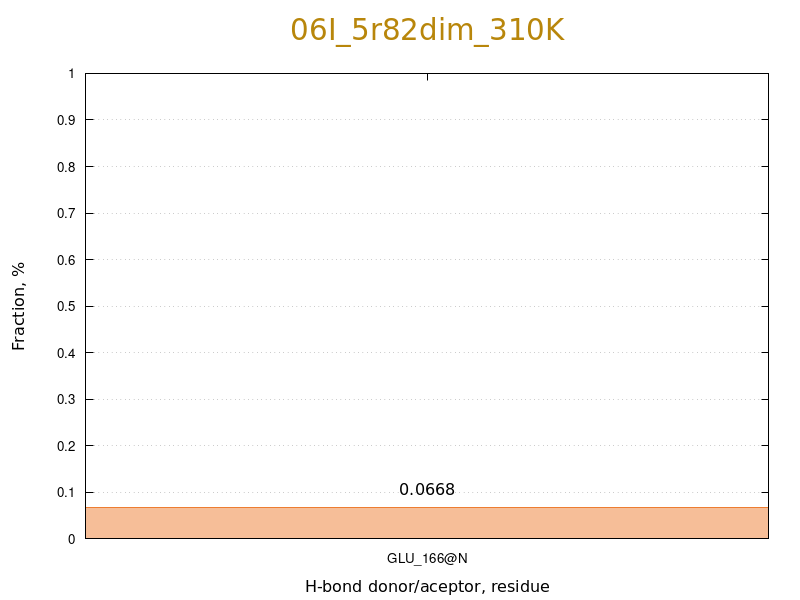
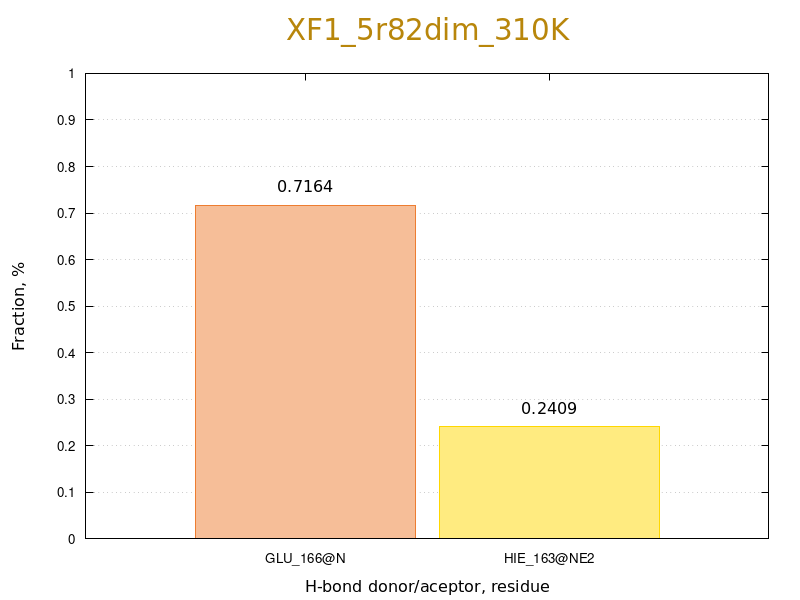
是否可以为条形图设置一些最小尺寸,使单个条形图的尺寸类似于有两个条形条的情况,例如:
回答 1
Stack Overflow用户
回答已采纳
发布于 2022-10-11 11:22:52
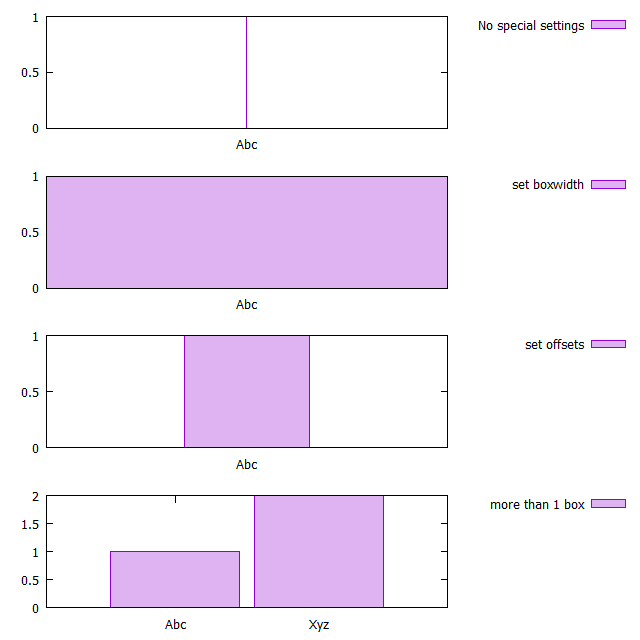
我的理解如下:如果您有,只有一个方框
- 可能会尝试自动缩放,而自动盒宽相对于自动范围很小(因此只是一条细线)。
- (如果你设置一定的盒子宽度,自动缩放到给定的盒子宽度(因此是充满方框的图表)。
- ,你可以设置一个固定的xrange,但这样你就失去了自动示波器的好处。相反,您可以使用
help offsets). - if (选中
set offets),您有超过1框的自动示波器将有效。
脚本:
### boxwidth with boxes style
reset session

$Data1 <<EOD
 1   Abc
EOD

$Data2 <<EOD
 1 Abc
 2 Xyz
EOD

set style fill solid 0.3
set key out
set rmargin screen 0.7
set yrange[0:]
set ytics 0.5

set multiplot layout 4,1

    plot $Data1 u 0:1:xtic(2) w boxes ti "No special settings"

    set boxwidth 0.9
    plot $Data1 u 0:1:xtic(2) w boxes ti "set boxwidth"

    set offsets 1,1,0,0
    plot $Data1 u 0:1:xtic(2) w boxes ti "set offsets"

    set offsets 0,0,0,0
    plot $Data2 u 0:1:xtic(2) w boxes ti "more than 1 box"

unset multiplot
### end of script
结果:
页面原文内容由Stack Overflow提供。腾讯云小微IT领域专用引擎提供翻译支持
原文链接:
https://stackoverflow.com/questions/74026034
复制相关文章
相似问题
腾讯云开发者

Copyright © 2013 - 2026 Tencent Cloud. All Rights Reserved. 腾讯云 版权所有
深圳市腾讯计算机系统有限公司 ICP备案/许可证号:粤B2-20090059 ![]() 粤公网安备44030502008569号
粤公网安备44030502008569号
腾讯云计算(北京)有限责任公司 京ICP证150476号 | 京ICP备11018762号