
使用颜色和尺寸显示标准系数大小的模型表
使用颜色和尺寸显示标准系数大小的模型表
提问于 2022-10-09 17:16:42
我试图制作一个多模型的表格,标准的系数,颜色编码和大小根据系数的大小。我将使用数十个模型来实现这一点,而且使用颜色和大小似乎是一种在预测器和模型之间显示模式的方法。像{corrplot}这样的东西是我感兴趣的,但我只需要一种颜色:
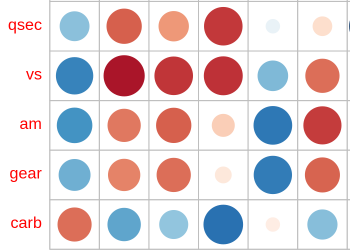
我也感兴趣的是,p值> .05的单元格是空白的,或者是非常模糊的或什么的。
下面是我正在研究的一个例子。
library(dplyr)
library(modelsummary)

dat <- mtcars %>% mutate(
  cyl = as.factor(cyl),
  gear = as.factor(gear)
)

## List of models
models = list(
  "MPG" = lm(mpg ~ cyl + hp + wt + qsec + vs + am + gear + carb, data = dat),
  "Disp" = lm(disp ~ cyl + hp + wt + qsec + vs + am + gear + carb, data = dat),
  "Drat" = lm(drat ~ cyl + hp + wt + qsec + vs + am + gear + carb, data = dat)
    )

## I feed the list of models to modelsummary() and ask for only coefficients and p.value as side by side columns
models.ep <-  modelsummary(models,
             standardize = "basic",
             shape = term ~ model + statistic,
             estimate = "{estimate}",
             statistic = "p.value" ,
             gof_map = NA,
             output = "data.frame")

## I started trying to use {formattable} but the color bars aren't what I want (I'm interested in the image shown above with the size and darkness/lightness of the circles representing effect magnitude.
library(formattable)
formattable(models.ep, list(
"MPG / Est." = color_bar("#e9c46a"),
"Disp / Est." = color_bar("#80ed99"),
"Drat / Est." = color_bar("#f28482")
                             ))

## I also looked around in the {flextable} but did not see a way to do what I need.回答 1
Stack Overflow用户
回答已采纳
发布于 2022-10-09 17:38:33
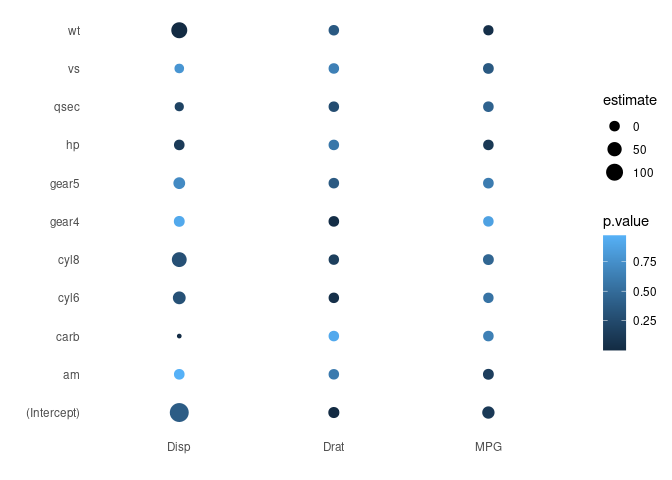
您可以使用来自modelsummary的modelsummary函数和ggplot2包实现类似于此的功能。这不完全是您给出的图像,但它可能会帮助您开始:
library(ggplot2)
library(modelsummary)

dat <- mtcars |> transform(
  cyl = as.factor(cyl),
  gear = as.factor(gear)
)

models = list(
  "MPG" = lm(mpg ~ cyl + hp + wt + qsec + vs + am + gear + carb, data = dat),
  "Disp" = lm(disp ~ cyl + hp + wt + qsec + vs + am + gear + carb, data = dat),
  "Drat" = lm(drat ~ cyl + hp + wt + qsec + vs + am + gear + carb, data = dat)
    )

results <- lapply(models, get_estimates)
results <- lapply(names(results), \(n) transform(results[[n]], model = n))
results <- do.call("rbind", results)

ggplot(results, aes(x = model, y = term, size = estimate, color = p.value)) +
    geom_point() +
    theme_minimal() +
    theme(panel.grid = element_blank()) +
    labs(x = "", y = "")
页面原文内容由Stack Overflow提供。腾讯云小微IT领域专用引擎提供翻译支持
原文链接:
https://stackoverflow.com/questions/74006883
复制相关文章
相似问题
腾讯云开发者

Copyright © 2013 - 2026 Tencent Cloud. All Rights Reserved. 腾讯云 版权所有
深圳市腾讯计算机系统有限公司 ICP备案/许可证号:粤B2-20090059 ![]() 粤公网安备44030502008569号
粤公网安备44030502008569号
腾讯云计算(北京)有限责任公司 京ICP证150476号 | 京ICP备11018762号