
如何根据shapefile多边形值分配颜色?
如何根据shapefile多边形值分配颜色?
提问于 2022-10-04 16:08:18
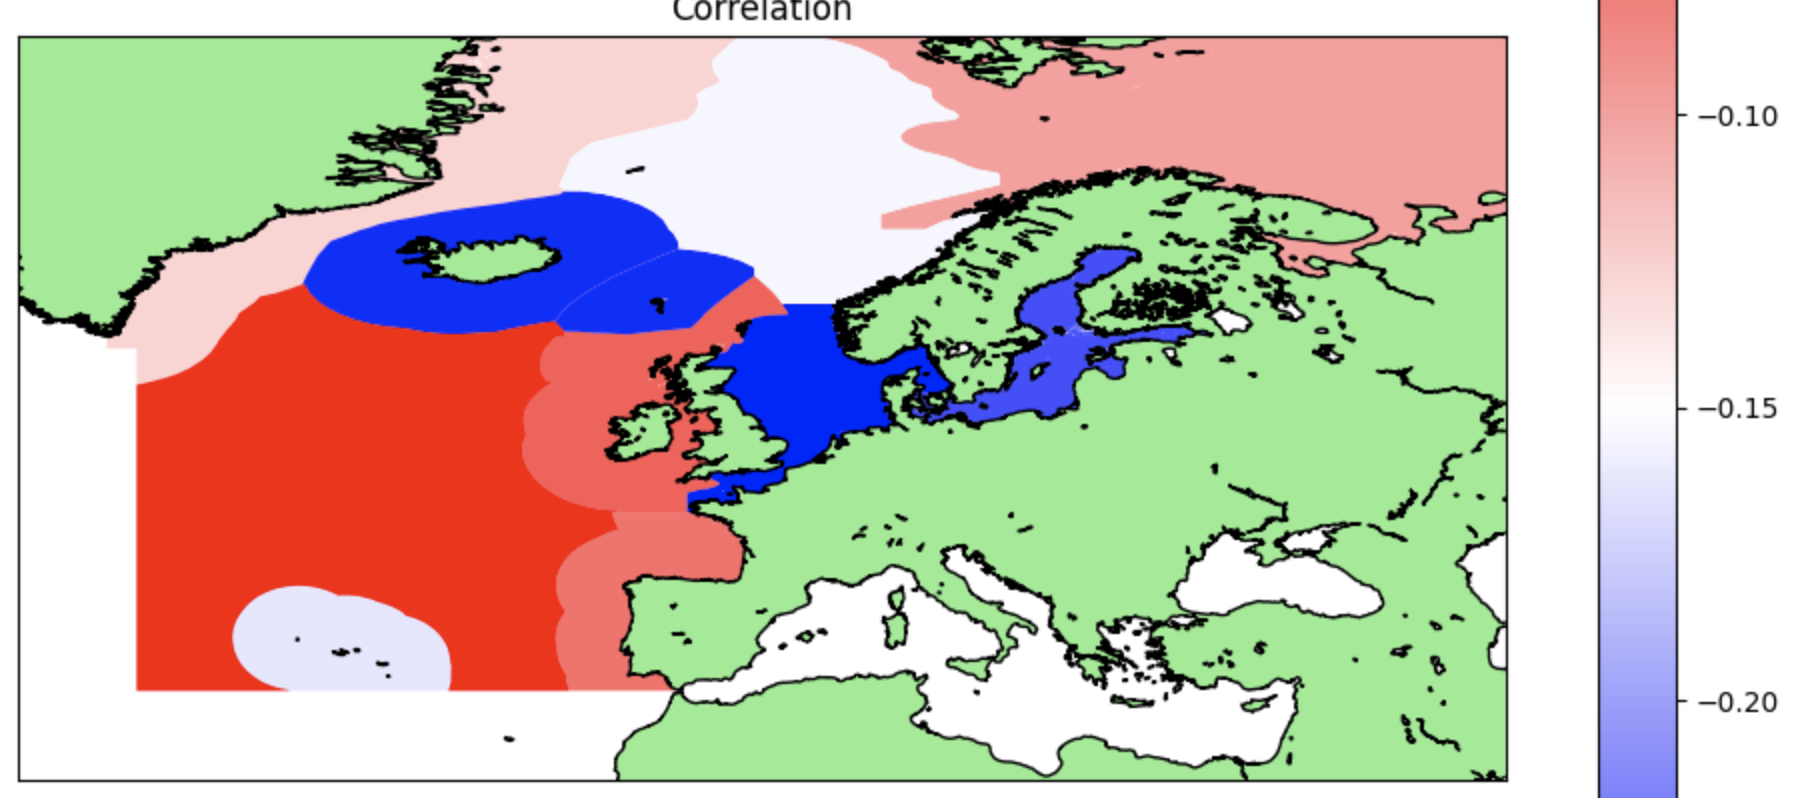
我在绘制一个基本地图区域的形状文件。具体而言,在地图上绘制列变量"PhytoNAOCo“。有一些行(多边形)的值为0.00,我想为这些多边形指定一个白色的颜色,以区别于其他多边形。下面是我目前使用的代码:
pip install geopandas
pip install contextily
import geopandas as gpd
import contextily as ctx

data = gpd.read_file("NAOAMOCorrEcoRegion.shp")
import matplotlib.pyplot as plt
ax=data.plot(figsize=(12,10), column="PhytoNAOCo", legend=True, cmap='bwr')
map = Basemap(llcrnrlon=-50,llcrnrlat=30,urcrnrlon=50.,urcrnrlat=80.,
             resolution='i', lat_0 = 39.5, lon_0 = 1)
map.fillcontinents(color='lightgreen')
map.drawcoastlines()
plt.title("Correlation")
这是指向文件- KKi8IBSQaDTKjiBYb0PIfA9me9/view?usp=共享的链接
我想在这个案子中会有某种循环(比如if data.PhytoNAOCo(i) == 0,否则.那么也许可以指定一个颜色?)但是我对Python并不熟悉,所以我不知道该怎么做。
回答 1
Stack Overflow用户
回答已采纳
发布于 2022-10-04 17:08:30
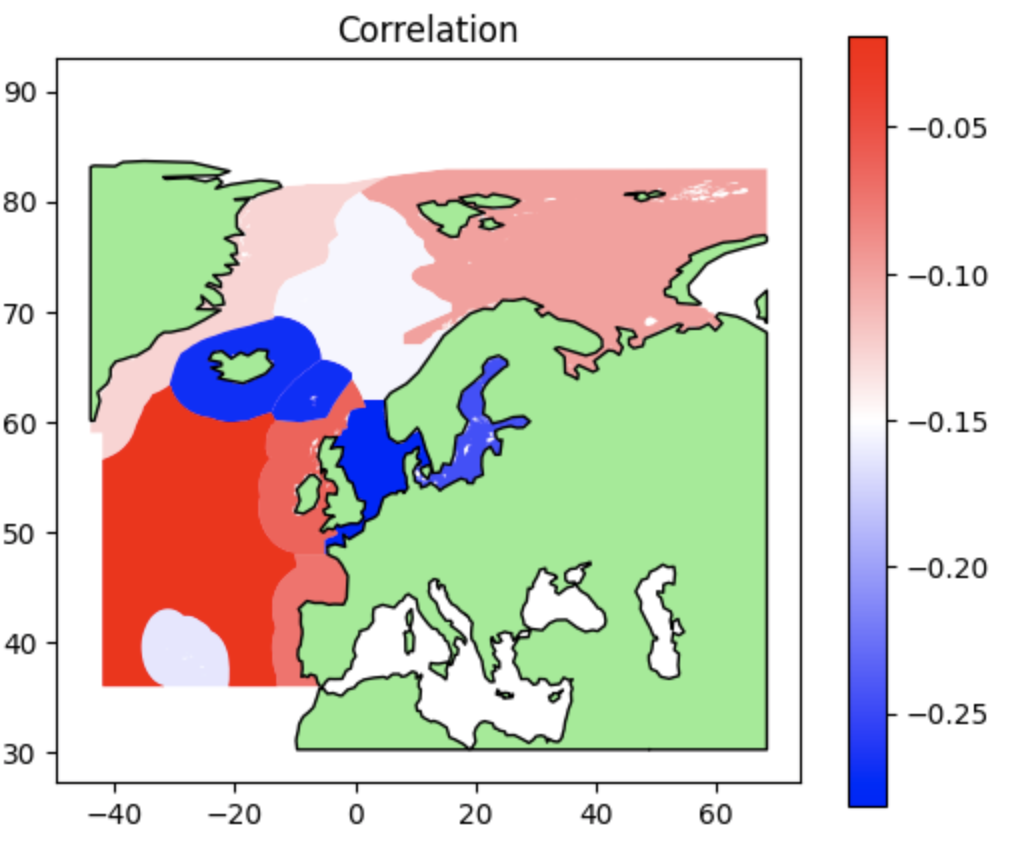
- 实际上,这是由地质公园地块
missing_kwds所涵盖的。 - 因此,将零行设置为
NaN,然后使用此内置功能
import contextily as ctx
from mpl_toolkits.basemap import Basemap
import matplotlib.pyplot as plt
import numpy as np

# data = gpd.read_file("NAOAMOCorrEcoRegion.shp")
# set 0 to nan
data.loc[data["PhytoNAOCo"].eq(0), "PhytoNAOCo"] = np.nan

ax = data.plot(
    figsize=(12, 10),
    column="PhytoNAOCo",
    legend=True,
    cmap="bwr",
    missing_kwds={"color":"white"},
)
map = Basemap(
    llcrnrlon=-50,
    llcrnrlat=30,
    urcrnrlon=50.0,
    urcrnrlat=80.0,
    resolution="i",
    lat_0=39.5,
    lon_0=1,
)
map.fillcontinents(color="lightgreen")
map.drawcoastlines()
plt.title("Correlation")
源数据
from io import BytesIO
from urllib.request import urlopen
from zipfile import ZipFile
from pathlib import Path
import tempfile
import geopandas as gpd

# zipurl = 'https://drive.google.com/file/d/1VbSYP_kKi8IBSQaDTKjiBYb0PIfA9me9/view?usp=sharing'
zipurl = 'https://drive.google.com/uc?export=download&id=1VbSYP_kKi8IBSQaDTKjiBYb0PIfA9me9'

with tempfile.TemporaryDirectory() as d:
    with urlopen(zipurl) as zipresp:
        with ZipFile(BytesIO(zipresp.read())) as zfile:
            zfile.extractall(d)
    data = gpd.read_file(list(Path(d).glob("*.shp"))[0])
大陆使用简单世界地图的替代方法
import matplotlib.pyplot as plt
import numpy as np

# data = gpd.read_file("NAOAMOCorrEcoRegion.shp")
# set 0 to nan
data.loc[data["PhytoNAOCo"].eq(0), "PhytoNAOCo"] = np.nan

ax = data.plot(
    figsize=(12, 10),
    column="PhytoNAOCo",
    legend=True,
    cmap="bwr",
    missing_kwds={"color": "white"},
)
ax = (
    gpd.read_file(gpd.datasets.get_path("naturalearth_lowres"))
    .dissolve() # just want coastlines, so combine all geometries
    .clip_by_rect(*data.total_bounds) # clip to bounds of interesting geometry...
    .plot(color="lightgreen", edgecolor="black", ax=ax)
)

plt.title("Correlation")
页面原文内容由Stack Overflow提供。腾讯云小微IT领域专用引擎提供翻译支持
原文链接:
https://stackoverflow.com/questions/73950661
复制相关文章
相似问题
腾讯云开发者

Copyright © 2013 - 2026 Tencent Cloud. All Rights Reserved. 腾讯云 版权所有
深圳市腾讯计算机系统有限公司 ICP备案/许可证号:粤B2-20090059 ![]() 粤公网安备44030502008569号
粤公网安备44030502008569号
腾讯云计算(北京)有限责任公司 京ICP证150476号 | 京ICP备11018762号