
in图中栅格数据的处理
in图中栅格数据的处理
提问于 2022-10-04 14:10:09
我有一个矢量空间数据代表一个县的边界,还有一个以光栅格式表示的同一县的地形数据。
我需要创建一个带有ggplot的地图,以便它只以栅格格式显示那些位于县边界内的数据(而这些数据又是在一个矢量空间文件中)。
换句话说,我需要删除县大纲之外的栅格数据。有可能用ggplot做这个吗?
可复制的例子:
# load packages
library(elevatr)
library(terra)
library(geobr)
# get the municipality shapefile (vectorized spatial data)
municipality_shape <- read_municipality(code_muni = 3305802)
plot(municipality_shape$geom)
# get the raster topographical data
prj_dd <- "EPSG:4674"
t <- elevatr::get_elev_raster(locations = municipality_shape,
z = 10,
prj = prj_dd)
obj_raster <- rast(t)
plot(obj_raster)
# create the ggplot map
df_tere_topo <- obj_raster %>%
as.data.frame(xy = TRUE) %>%
rename(altitude = file40ac737835de)
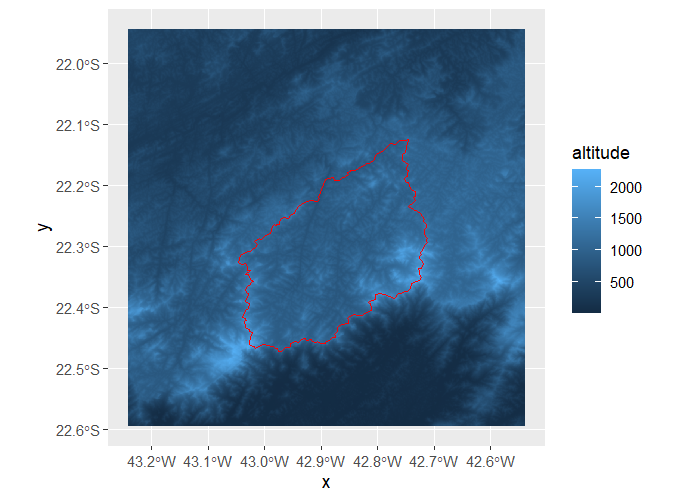
ggplot()+
geom_raster(data = df_tere_topo, aes(x = x, y = y, fill = `altitude`))+
geom_sf(municipality_shape, mapping = aes(), color = 'red', fill = NA)回答 1
Stack Overflow用户
回答已采纳
发布于 2022-10-04 15:32:21
编辑过的
请参见注释,使用terra::crop()和terra::mask()代替:
# load packages
library(elevatr)
library(terra)
library(geobr)
library(dplyr)
library(ggplot2)
# Use tidyterra
library(tidyterra)
# get the municipality shapefile (vectorized spatial data)
municipality_shape <- read_municipality(code_muni = 3305802)
# get the raster topographical data
prj_dd <- "EPSG:4674"
t <- elevatr::get_elev_raster(
locations = municipality_shape,
z = 10,
prj = prj_dd
)
obj_raster <- rast(t)
# Crop + Mask
obj_raster_mask <- crop(obj_raster, vect(municipality_shape)) %>%
mask(vect(municipality_shape))
# create the ggplot map
# using tidyterra
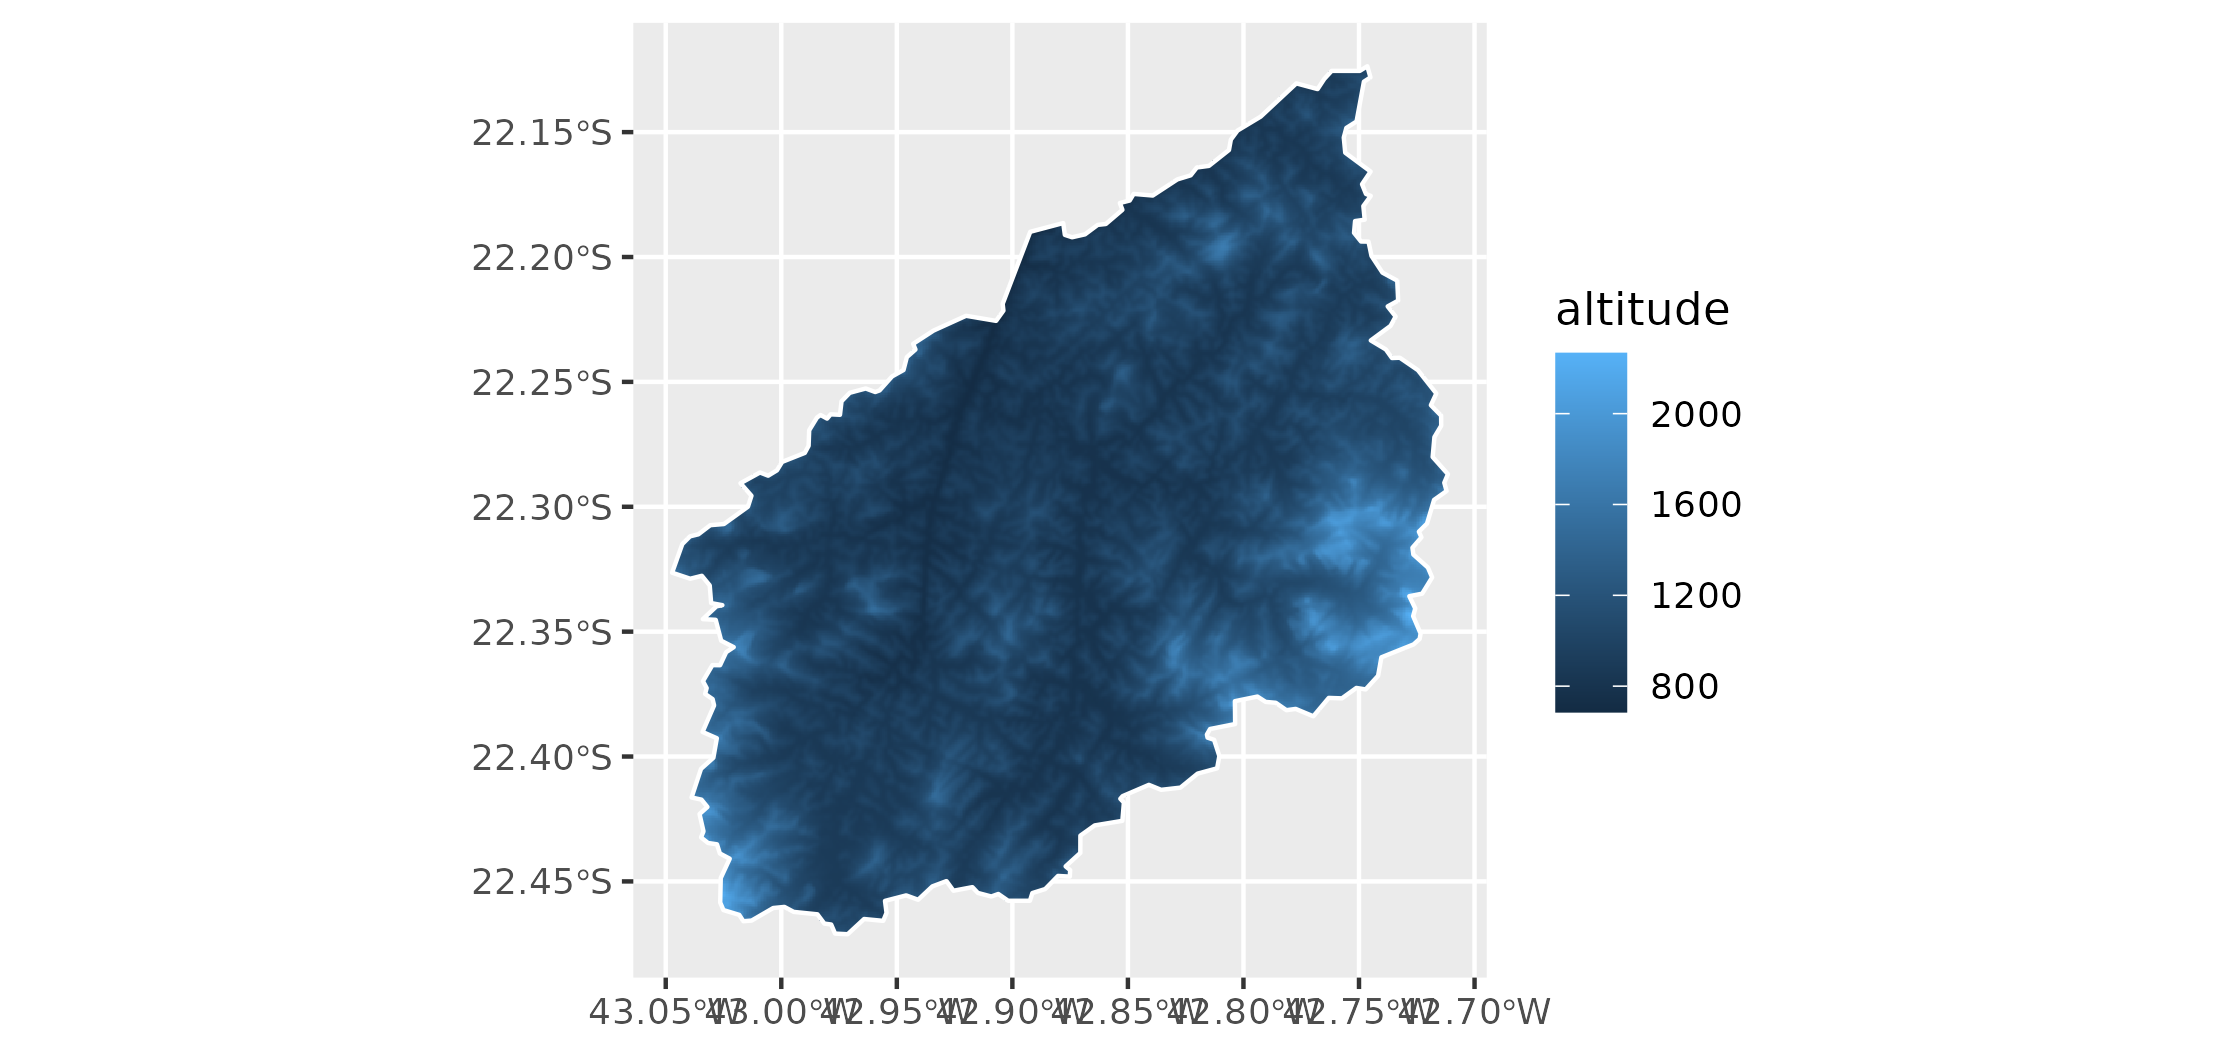
ggplot() +
geom_spatraster(data = obj_raster_mask) +
geom_sf(municipality_shape, mapping = aes(), color = "white", fill = NA) +
# Not plotting NAs of the raster
scale_fill_continuous(na.value = NA) +
labs(fill="altitude")
原始答案
我认为最有效的方法是在向量数据的范围内crop您的SpatRaster。使用这种方法,绘图效率更高,因为您没有使用不需要绘图的数据。
另一种选择是在coord_sf()中设置限制。
在这个reprex上,我还使用了包tidyterra,它有一些功能可以使用ggplot2 + terra (我是tidyterra的开发人员):
# load packages
library(elevatr)
library(terra)
library(geobr)
library(dplyr)
library(ggplot2)
# Use tidyterra
library(tidyterra)
# get the municipality shapefile (vectorized spatial data)
municipality_shape <- read_municipality(code_muni = 3305802)
# get the raster topographical data
prj_dd <- "EPSG:4674"
t <- elevatr::get_elev_raster(
locations = municipality_shape,
z = 10,
prj = prj_dd
)
obj_raster <- rast(t)
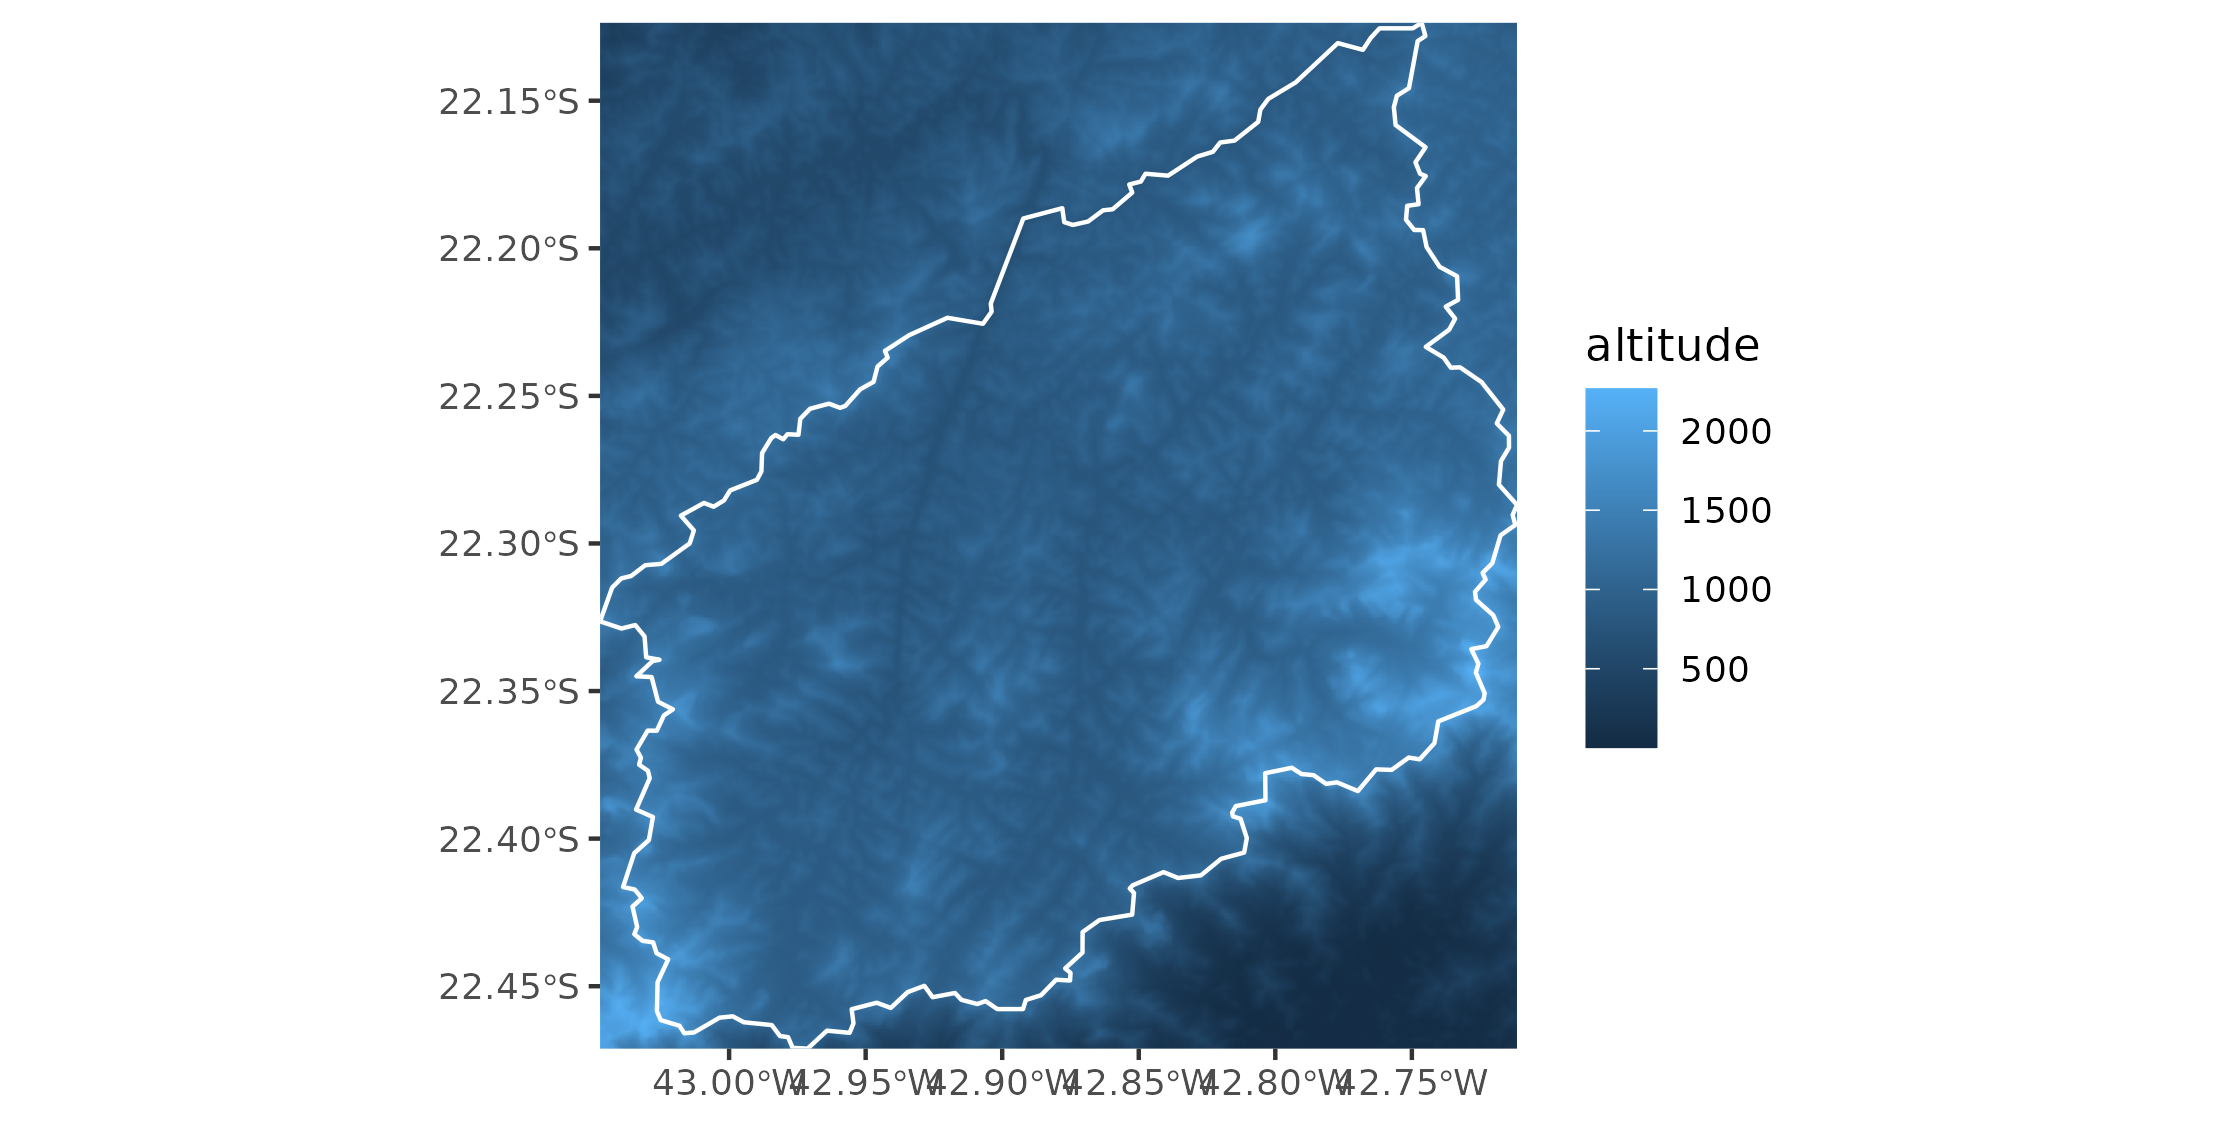
# Option1: Crop first
obj_raster_crop <- crop(obj_raster, vect(municipality_shape))
# create the ggplot map
# using tidyterra
ggplot() +
geom_spatraster(data = obj_raster_crop) +
geom_sf(municipality_shape, mapping = aes(), color = "white", fill = NA) +
coord_sf(expand = FALSE) +
labs(fill="altitude")

 # Option 2: Use limits and no crop
lims <- sf::st_bbox(municipality_shape)

ggplot() +
  geom_spatraster(
    data = obj_raster,
    # Avoid resampling
    maxcell = ncell(obj_raster)
  ) +
  geom_sf(municipality_shape, mapping = aes(), color = "white", fill = NA) +
  coord_sf(
    expand = FALSE,
    xlim = lims[c(1, 3)],
    ylim = lims[c(2, 4)]
  ) +
  labs(fill="altitude")
页面原文内容由Stack Overflow提供。腾讯云小微IT领域专用引擎提供翻译支持
原文链接:
https://stackoverflow.com/questions/73949232
复制相关文章
相似问题
腾讯云开发者

Copyright © 2013 - 2026 Tencent Cloud. All Rights Reserved. 腾讯云 版权所有
深圳市腾讯计算机系统有限公司 ICP备案/许可证号:粤B2-20090059 ![]() 粤公网安备44030502008569号
粤公网安备44030502008569号
腾讯云计算(北京)有限责任公司 京ICP证150476号 | 京ICP备11018762号