
如何在R中求和不同的因子值?
我有一个由2787行和259列组成的示例。
为了将此作为背景,这是一项关于西班牙人民如何看待他们目前的经济状况的调查,与6个月前由西班牙一个研究机构独联体进行的调查相比。
因此,我有一个列(P3),有5个答案:“更好”、“更糟”、“相同”、“不知道”和“不回答”。另外,我还有一个专栏(P19),有两个选项(男性“1”,女性"2“)。
我想知道的是,人们是如何根据他们的性别来评价他们当前的经济状况和过去的经济状况的(并绘制这幅图)。换句话说,看看有多少男性对自己的处境“更好”,有多少人认为“更糟”等等;同样,女性也是如此。
为了实现这一点,我一直试图运行以下代码:
CVSPastIndividualSituationMales<- aggregate(CIS$P3 ~ CIS$P19 == "1", CIS, sum)
CVSPastIndividualSituationFemales<- aggregate(CIS$P3 ~ CIS$P19 == "2", CIS, sum)


CurrentVSPastIndividualSituationMales<-ggplot(CIS,mapping=aes(x=CVSPastIndividualSituationMales))+geom_bar(fill="LightGreen")+xlab("Current VS Past Individual Situation for Males")
CurrentVSPastIndividualSituationFemales <-ggplot(CIS,mapping=aes(CVSPastIndividualSituationFemales))+geom_bar(fill="Green") + xlab("Current VS Past Individual Situation for Females")

ggarrange(CurrentVSPastIndividualSituationMales, CVSPastIndividualSituationFemales, ncol = 1, nrow = 1)
但是,我得到以下错误:
Don't know how to automatically pick scale for object of type data.frame. Defaulting to continuous.
Error in `check_aesthetics()`:
! Aesthetics must be either length 1 or the same as the data (2787): x
Backtrace:
  1. ggpubr::ggarrange(...)
  2. purrr::map(...)
  3. ggpubr (local) .f(.x[[i]], ...)
  4. cowplot::plot_grid(plotlist = plotlist, ...)
  5. cowplot::align_plots(...)
     ...
 16. ggplot2 (local) by_layer(function(l, d) l$compute_aesthetics(d, plot))
 17. ggplot2 (local) f(l = layers[[i]], d = data[[i]])
 18. l$compute_aesthetics(d, plot)
 19. ggplot2 (local) f(..., self = self)
 20. ggplot2:::check_aesthetics(evaled, n)
 Error in check_aesthetics(evaled, n) :
有没有人知道我做错了什么,我如何才能得到想要的结果?
事先非常感谢!
可能有Dplyr的解决方案吗?
回答 2
Stack Overflow用户
发布于 2022-09-24 10:31:18
问题是,您可以在x美学上映射您的聚合数据集,但是将原始数据传递给data参数。
用一些假数据来模拟你的真实数据,我第一次复制你的问题:
library(ggplot2)
library(ggpubr)

set.seed(123)

CIS <- data.frame(
  P19 = sample(c(1:2), 100, replace = TRUE),
  P3 = sample(1:5, 100, replace = TRUE)
)

CVSPastIndividualSituationMales<- aggregate(CIS$P3 ~ CIS$P19 == "1", CIS, sum)
CVSPastIndividualSituationFemales<- aggregate(CIS$P3 ~ CIS$P19 == "2", CIS, sum)

CurrentVSPastIndividualSituationMales<-ggplot(CIS,mapping=aes(x=CVSPastIndividualSituationMales))+geom_bar(fill="LightGreen")+xlab("Current VS Past Individual Situation for Males")
CurrentVSPastIndividualSituationFemales <-ggplot(CIS,mapping=aes(CVSPastIndividualSituationFemales))+geom_bar(fill="Green") + xlab("Current VS Past Individual Situation for Females")

ggarrange(CurrentVSPastIndividualSituationMales, CVSPastIndividualSituationFemales, ncol = 1, nrow = 1)
#> Don't know how to automatically pick scale for object of type data.frame. Defaulting to continuous.
#> Error in `check_aesthetics()`: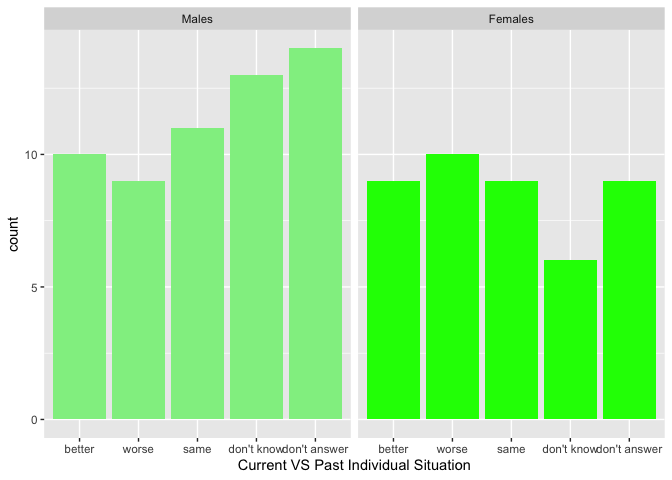
#> ! Aesthetics must be either length 1 or the same as the data (100): x虽然修复这个问题并不是一项大任务,但是总的来说,只需要像这样的ggplot2就可以轻松得多。首先,geom_bar将在默认情况下计算计数。所以我们不需要聚合。第二,与其制作两个情节,你可以制作一个情节,并使用facet_wrap获得不同性别的单独情节。最后,您可以在fill上映射性别并通过scale_fill_manual设置所需的颜色。
library(ggplot2)

set.seed(123)

CIS <- data.frame(
  P19 = sample(c(1:2), 100, replace = TRUE),
  P3 = sample(1:5, 100, replace = TRUE)
)

CIS$P3 <- factor(CIS$P3, labels = c("better", "worse", "same", "don't know", "don't answer"))
CIS$P19 <- factor(CIS$P19, labels = c("Males", "Females"))

ggplot(CIS, aes(P3, fill = P19)) +
  geom_bar() +
  scale_fill_manual(values = c("LightGreen", "Green"), guide = "none") +
  facet_wrap(~P19) +
  xlab("Current VS Past Individual Situation")
Stack Overflow用户
发布于 2022-09-24 11:21:42
这也可以使用基R来实现。
set.seed(1000)
spain_data<-data.frame(P3=sample(c("better","worse","same","don't know","don't answer"),30,replace = TRUE),P19=sample(c(1,2),30,replace = TRUE))
male_pos<-which(spain_data$P19==1)
female_pos<-which(spain_data$P19==2)
male_response<-spain_data$P3[male_pos]
female_response<-spain_data$P3[female_pos]
bar<-barplot(rbind(table(male_response),table(female_response)),beside = TRUE,col = c("red","green"),ylim = c(0,( max(rbind(table(male_response),table(female_response)))+2)))
text(bar,rbind(table(male_response),table(female_response))+0.2,labels = as.character(rbind(table(male_response),table(female_response))))
legend("topleft",c("Male","Female"),fill=c("red","green"),bty = "n",cex=0.9)
如果想要为男性和女性分别制作酒杯,那么
barplot(table(male_response))
barplot(table(female_response))https://stackoverflow.com/questions/73836015
复制相似问题
腾讯云开发者

Copyright © 2013 - 2026 Tencent Cloud. All Rights Reserved. 腾讯云 版权所有
深圳市腾讯计算机系统有限公司 ICP备案/许可证号:粤B2-20090059 ![]() 粤公网安备44030502008569号
粤公网安备44030502008569号
腾讯云计算(北京)有限责任公司 京ICP证150476号 | 京ICP备11018762号